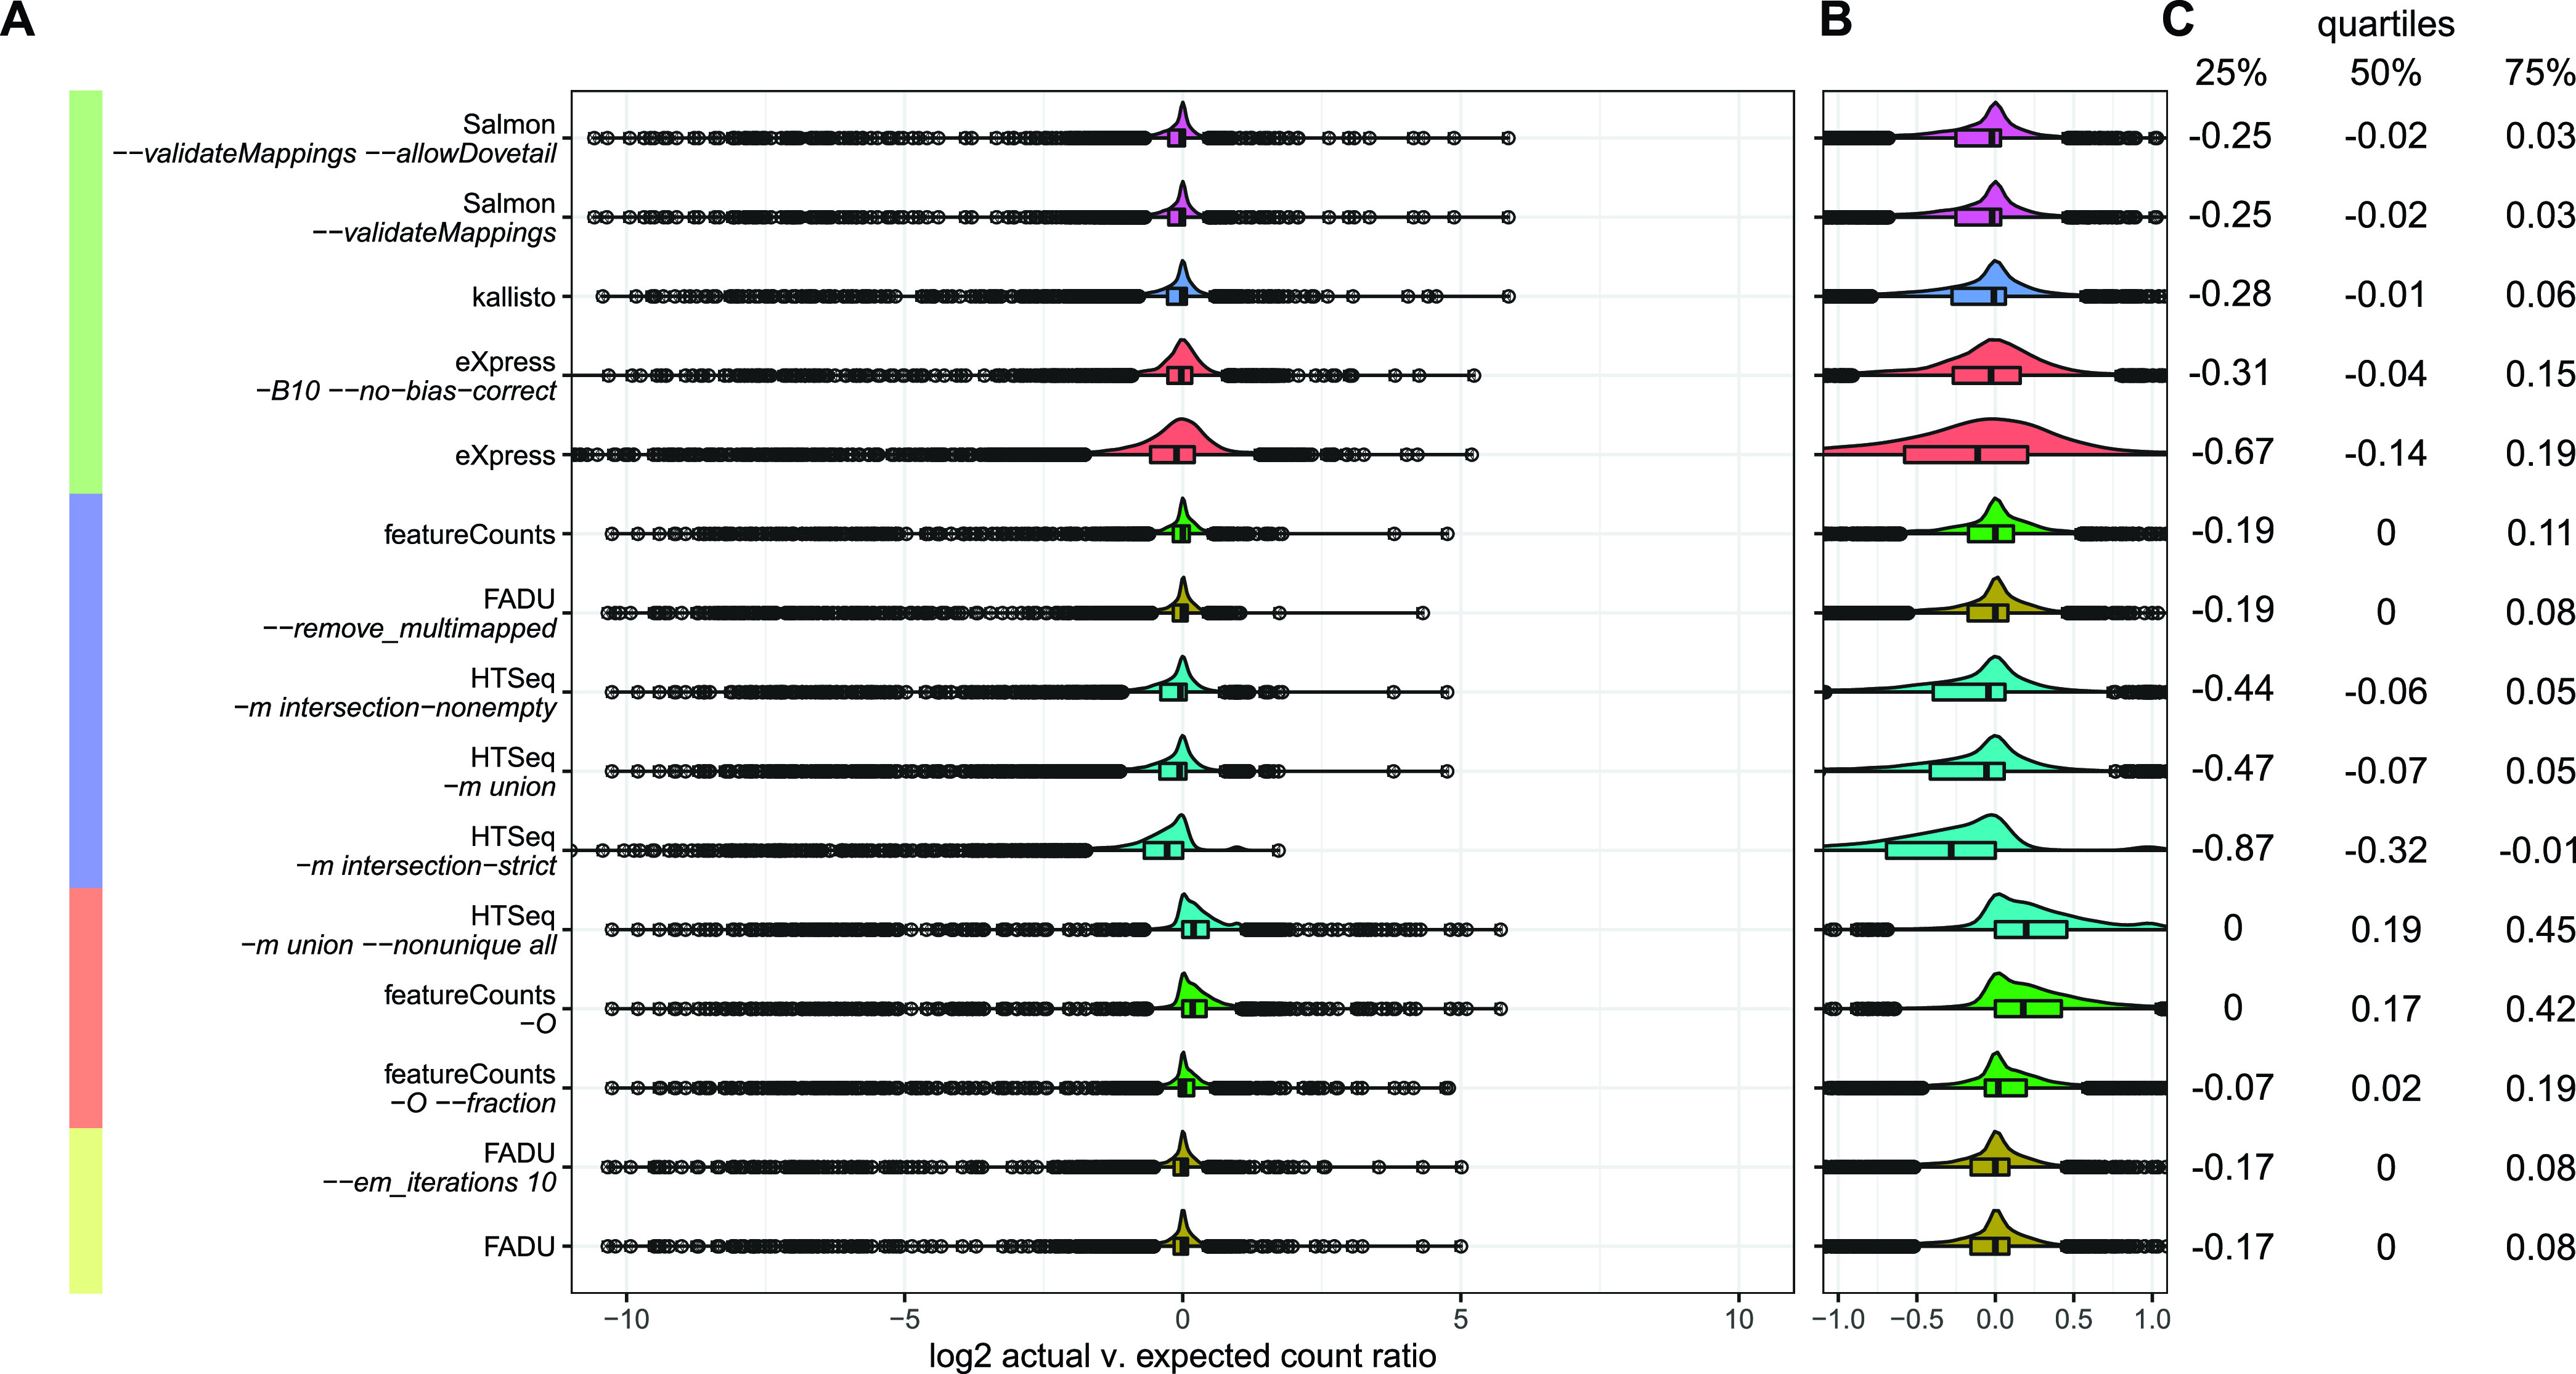
FIG 3.

Accuracy of FADU in a simulated RNA-Seq data set. (A) For each quantification method, a log2 ratio was calculated for the counts obtained for each gene in the simulated data set versus the actual counts expected from the simulated data set. The distributions for each of these methods would ideally be normal and centered at zero. (B) Zoomed-in version of the distribution generated from the log2 ratios. (C) The interquartile ranges for each of the distributions show the precision of each method.
