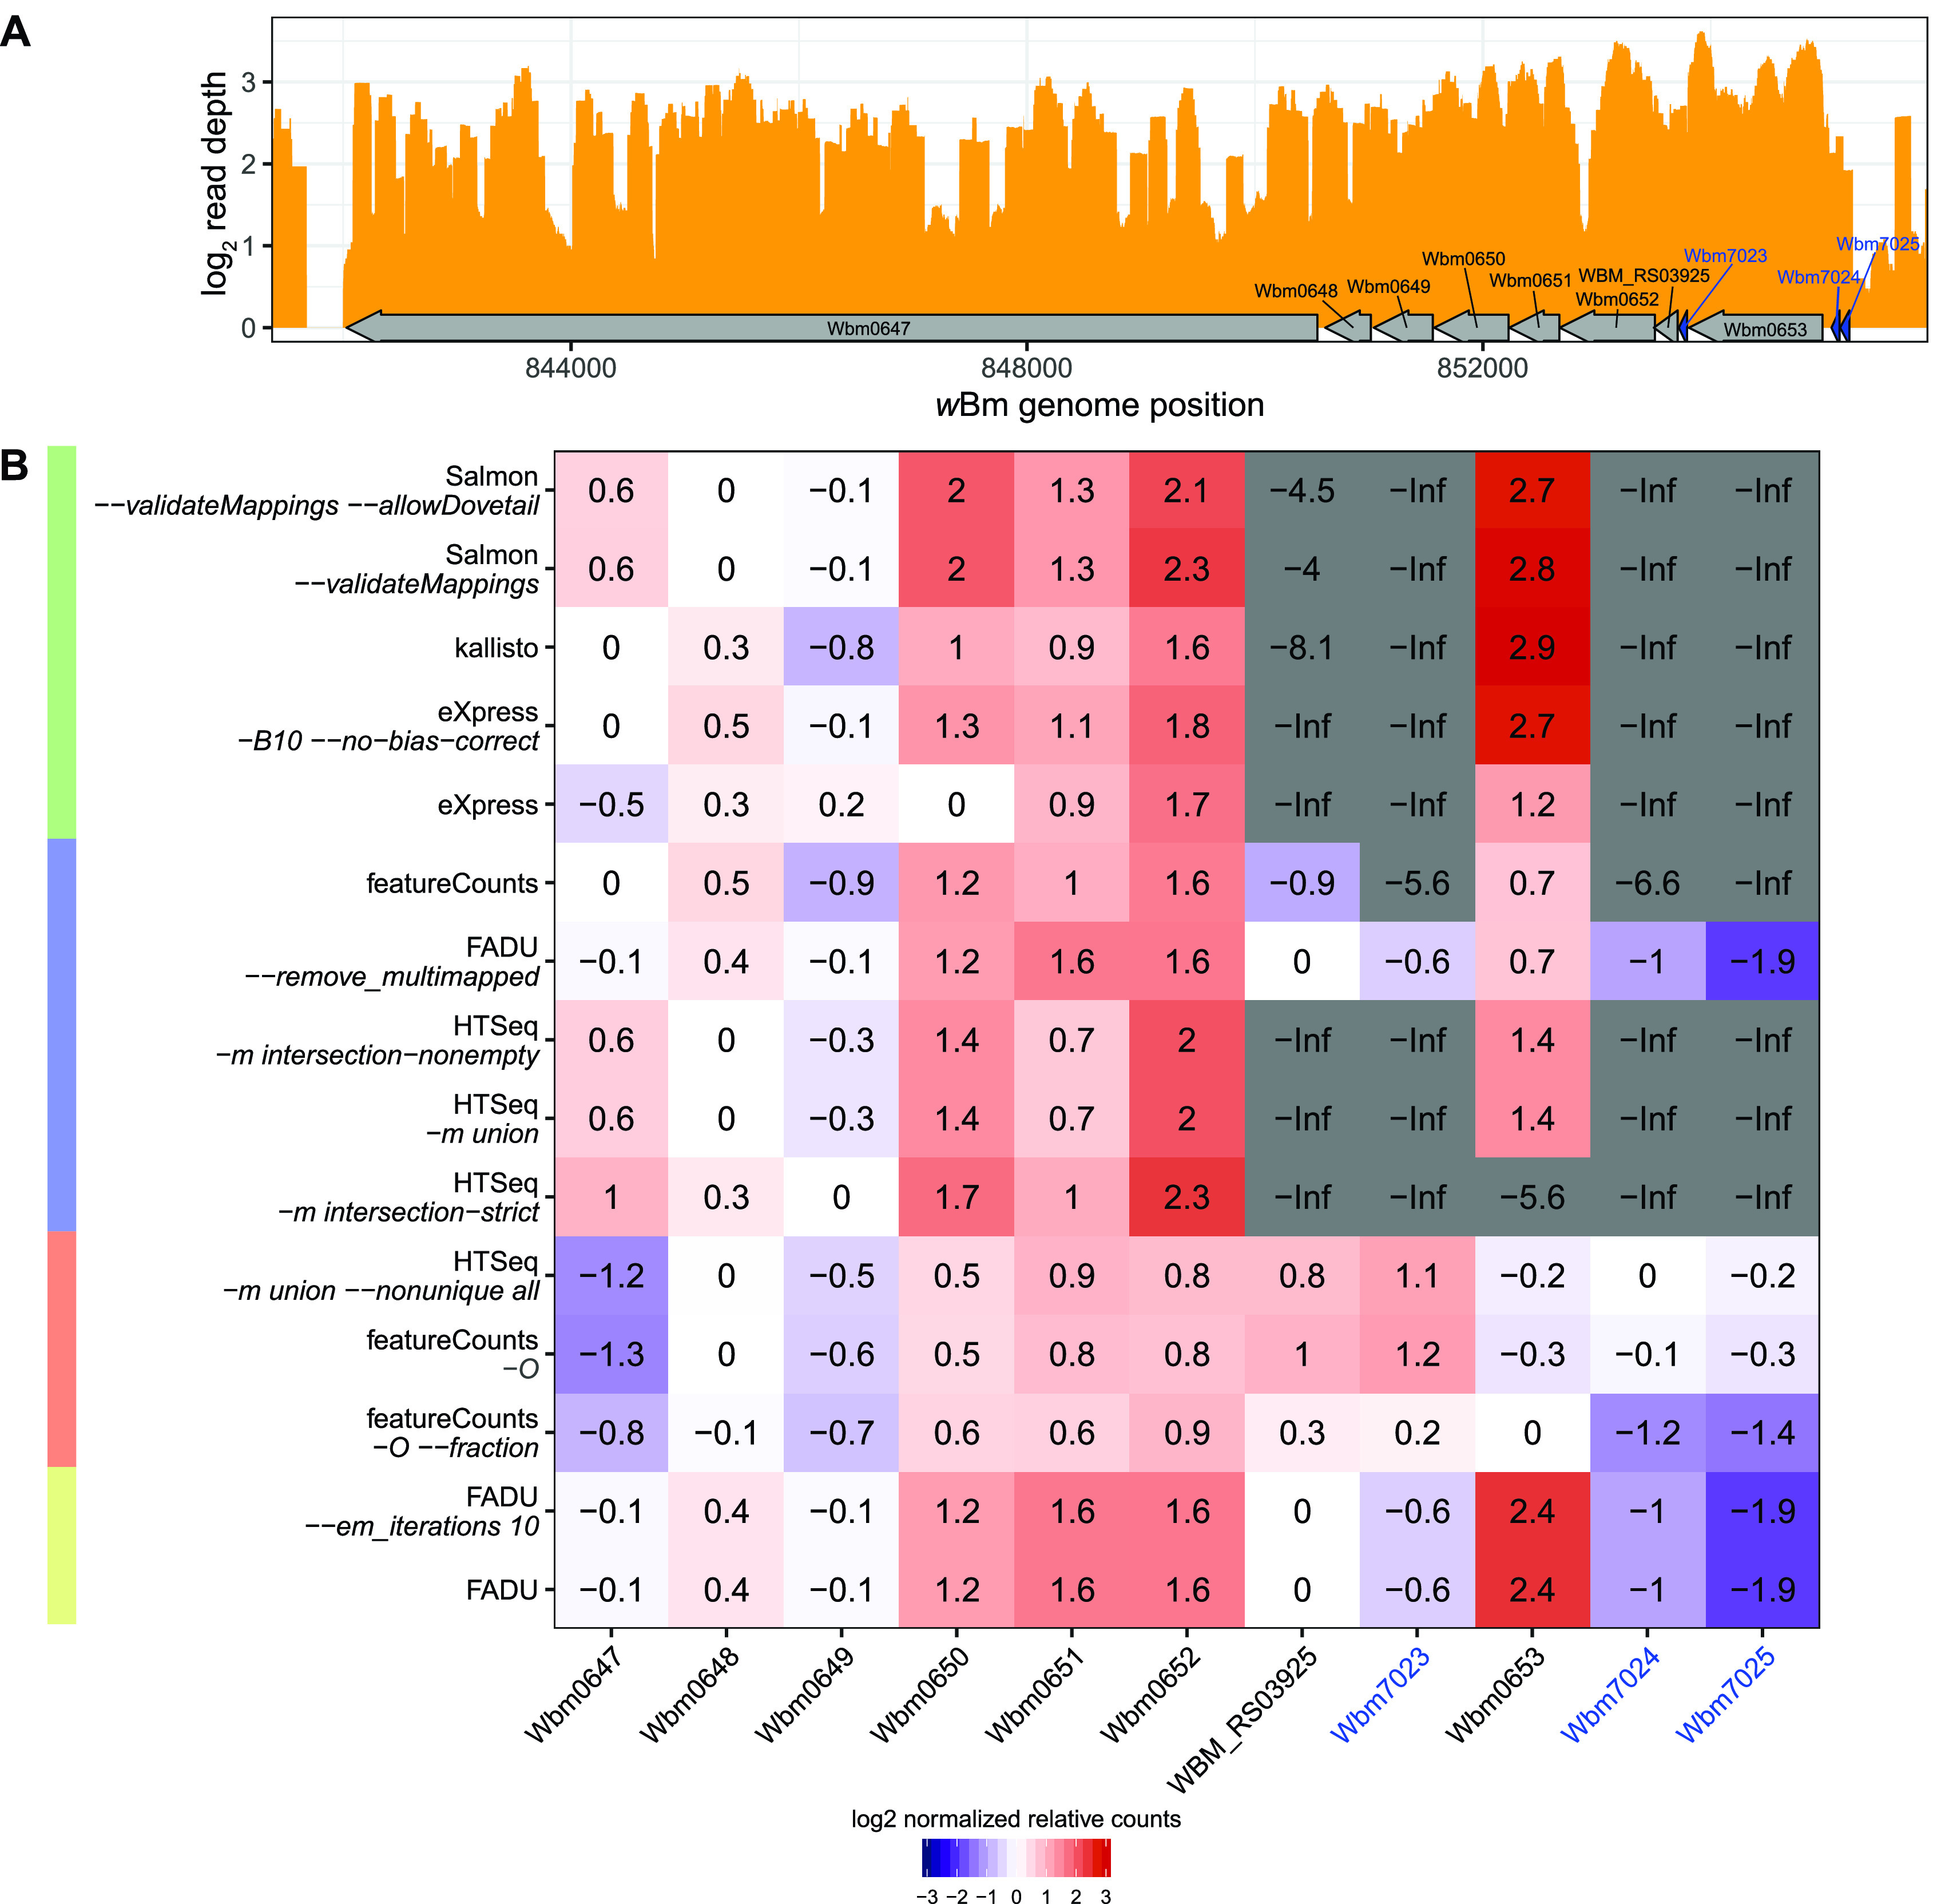
FIG 5.

Performance of quantification tools for deriving counts for operons. (A) Using the wBm stranded RNA-Seq data set, the log2 read depth (orange) was plotted for part of an operon containing 11 genes. Genes labeled and marked in blue are all significantly undercounted (log2 count ratio of less than −1), as assessed in Fig. 4. (B) For each quantification tool, the read depth per base pair was calculated for all 11 genes displayed and divided by the median read depth per base pair across the operon for each quantification mode to obtain a normalized relative count value. The log2-transformed normalized relative count values are displayed in the individual cells of the table. -Inf is used to denote when the quantification tool returned “0” for the gene such that the ratio cannot be log transformed. Because the 11 genes are transcribed together, we would expect the normalized values obtained for each of the 11 genes to be ∼0. Normalized values in red cells indicate that the gene has a higher count value than the other operonic genes, while blue cells indicate that the gene has a lower count value than the other operonic genes. Tools that discard ambiguous reads spanning two features in close proximity have a tendency to undercount the smaller genes in operons, such as Wbm7023, Wbm7024, and Wbm7025.
