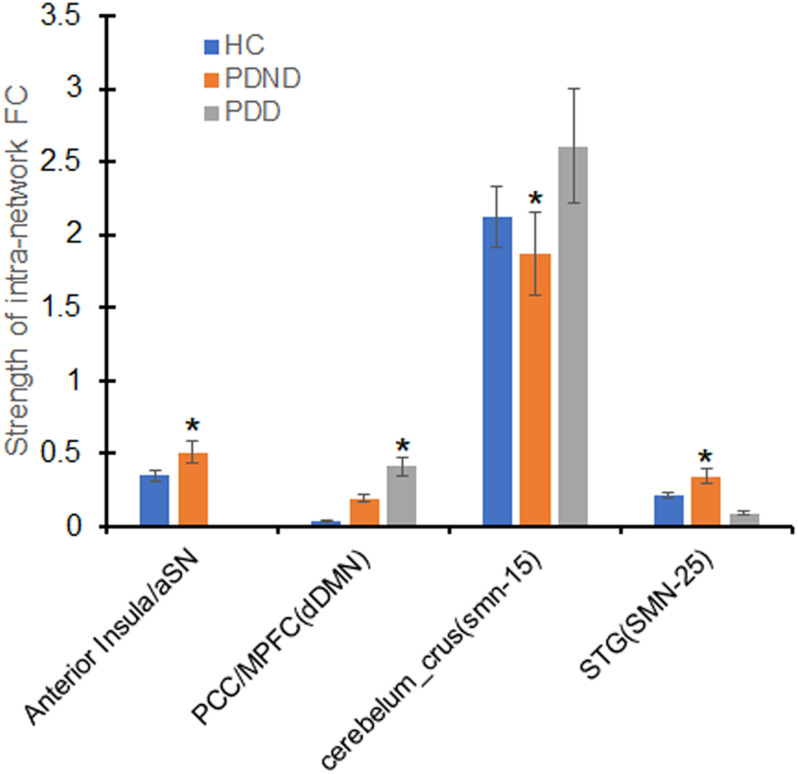
FIGURE 2.
Differences of in the intra-network functional connectivity (FC) analysis. The x-axis represents the brain regions of the resting-state networks (RSNs) (parentheses), and the y-axis represents the mean value of intra-network FC strength. Error bars indicate the standard errors of the means. ∗p < 0.05, uncorrected, PDD vs. PDND. aSN, anterior salience network; SMN (IC15/IC25), sensorimotor network; dDMN, dorsal default mode network; STG, superior temporal gyrus; PDD, Parkinson’s disease with depression; PDND, PD patients without depression; HC, healthy control.

