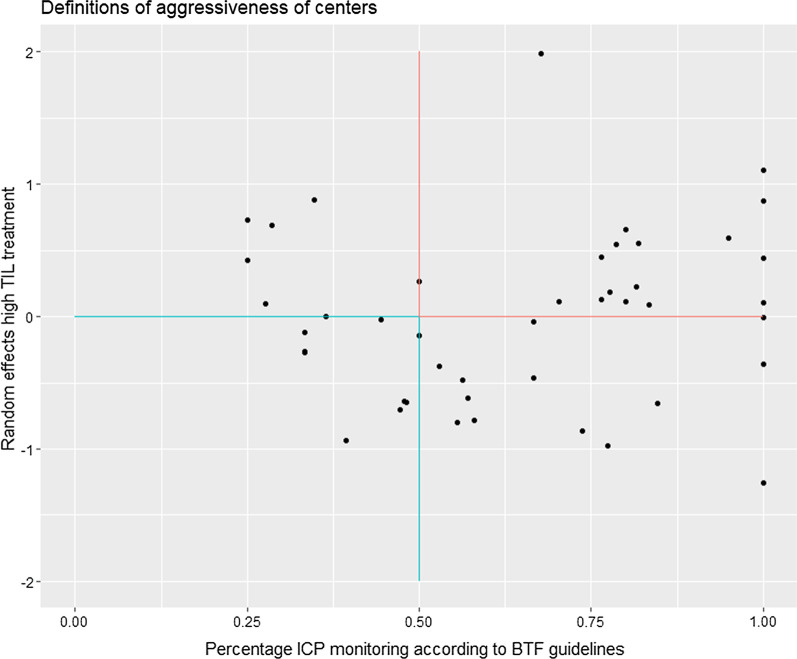
Fig. 3.
Definitions of aggressiveness. This figure illustrates the concordance between two definitions to identify aggressiveness of centers. On the x-axis is the definition of aggressiveness according to previous studies: the percentage of patients receiving ICP monitoring according to the BTF guidelines (GCS < 8 and abnormal CT, or normal CT and 2 or more of the following: hypotension, age > 40 years, unilateral or bilateral motor posturing, or systolic blood pressure (BP) < 90 mmHg). This percentage ICP monitoring was calculated in the ICU database (including all patients). On the y-axis is the definition of aggressiveness according to our study: the random effects of high TIL treatment per centers (log odds of receiving high TIL treatment). The upper right quadrant shows the centers that are both identified as aggressive by the previous definition (threshold 50% ICP monitoring) and the definition in our study (threshold random effect of zero).The lower left quadrant shows the centers that are identified as non-aggressive centers by both definitions. The two other quadrants show a discrepancy between the definitions of aggressiveness. Overall, there is no relationship between aggressiveness defined using ICP monitoring rates and actual use of aggressive therapies for ICP control

