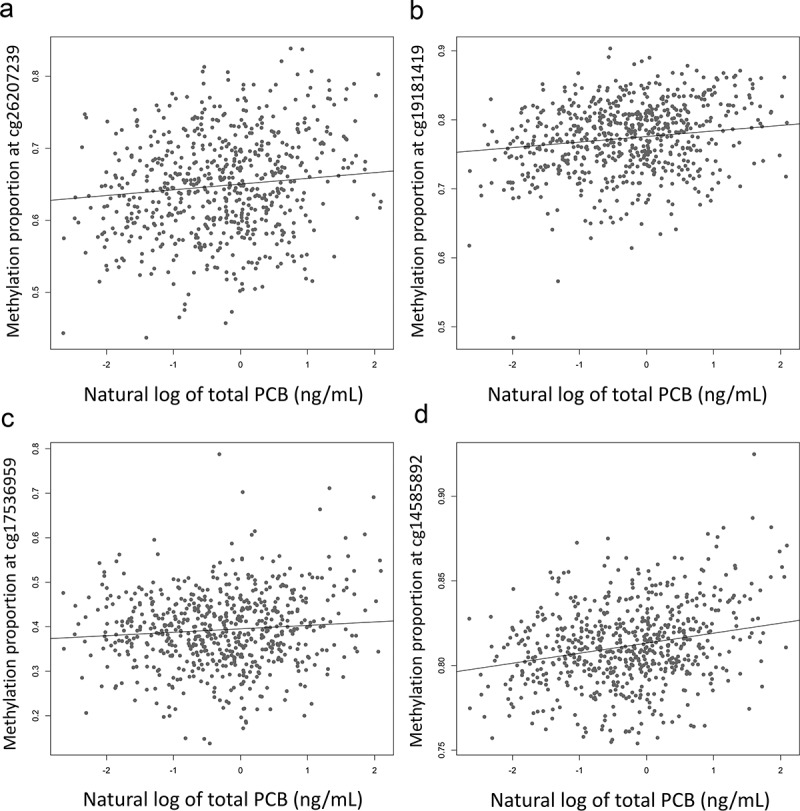
Figure 2.

Scatterplots of the CpGs most highly associated with total PCB levels. The top CpGs most associated with total PCB: cg26207239 (BIRC2, p = 1.96e-10; (a), cg19181419 (p = 1.35e-10; (b), cg17536959 (p = 1.60e-9; (c), cg14585892 (LY6D, p = 2.81e-9; (d). The solid line is the regression of DNA methylation proportion at that CpG on total PCB level (controlling for age, sex and 24 surrogate variables)
