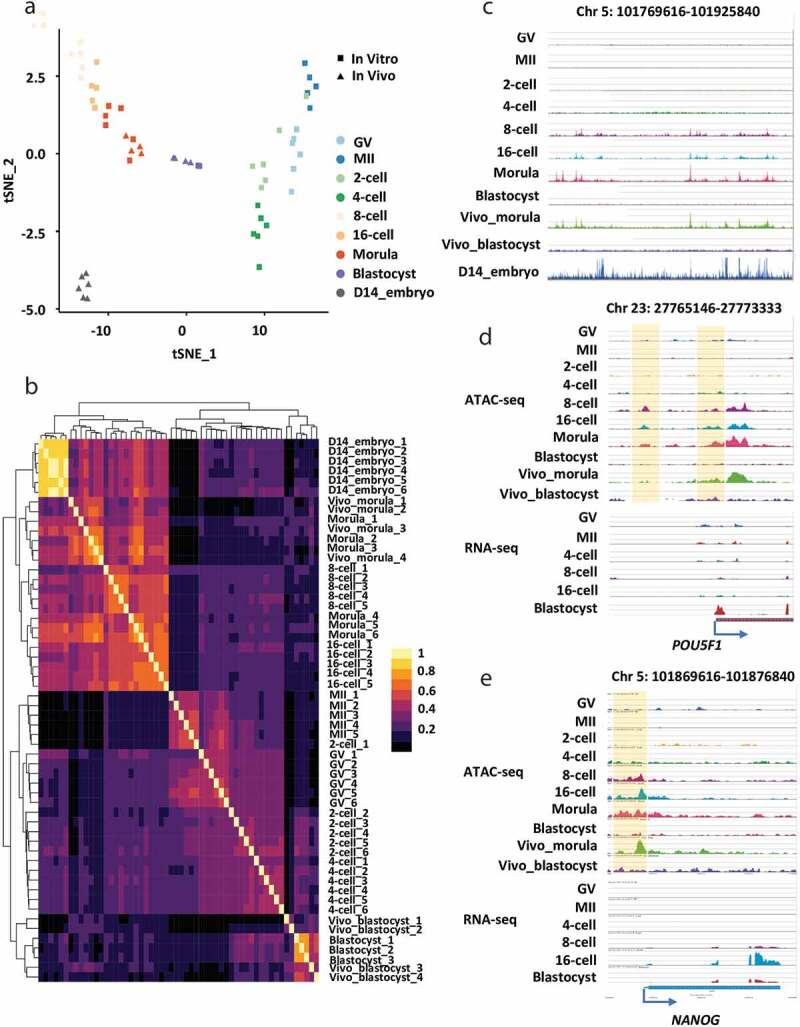
Figure 1.

Accessible chromatin landscape in bovine oocytes and early embryos. (a) Distribution of samples in the two-dimensional space, where the embeddings were computed by t-SNE with the data of the pairwise Pearson correlation evaluated using the accessibility of 2,000bp genome bins. (b) Hierarchical clustering of all samples, where the distance among samples was measured by the pairwise Pearson correlation evaluated using the accessibility of 2,000bp genome bins. The colour spectrum, ranging from yellow to black, indicates correlation from high to low. (c) The genome browser view showing the enrichment of ATAC-seq peaks in bovine oocytes and early embryos. The genome browser views showing the ATAC-seq peaks and RNA-seq reads enrichment near POU5F1 (d) and NANOG1 (e)
