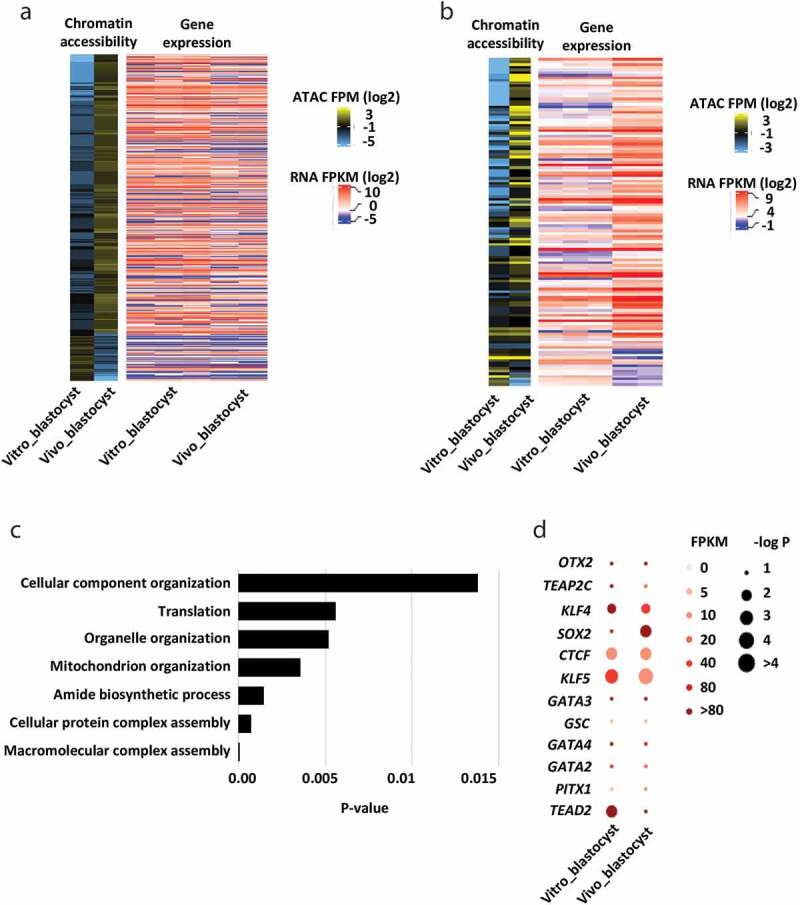
Figure 4.

Differences of chromatin accessibilities between in vivo and in vitro derived embryos. (a) Heat map showing the promoter chromatin accessibilities of in vitro and in vivo derived blastocysts (≥4-fold change), together with the corresponding gene expression. (b) Heat map showing the identified genes with consistent changes in the promoter chromatin accessibilities and their expression levels between in vitro and in vivo derived blastocyst (p-value < 0.05). (c) Top represented GO terms for genes with consistent changes in promoter chromatin accessibilities and expression levels between in vitro and in vivo derived blastocysts. (d) Transcription factor motifs identified from distal ATAC-seq peaks between in vitro and in vivo derived blastocysts
