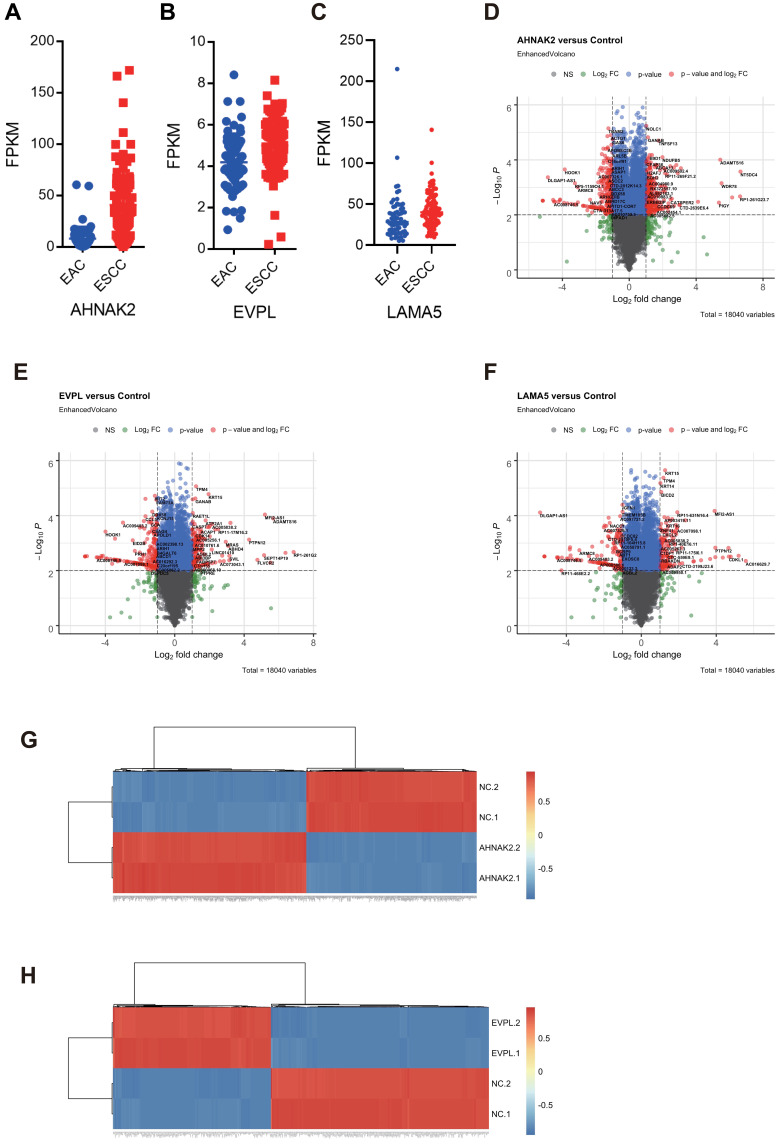
Figure 4.
Transcriptome analyses of siRNA knockdown AHNAK2, EVPL and LAMA5. (A-C) Highly expressed AHNAK2 (A), EVPL (B) and LAMA5 (C) in ESCC. Expression of AHNAK2, EVPL and LAMA5 were analyzed in esophageal cancer of TCGA pancancer database, including ESCC and esophageal adenocarcinoma (EAC). (D–F) Volcano plot showed the different expressional genes (DEGs) in siRNA-AHNAK2 (D), siRNA-EVPL (E) and siRNA-LAMA5 (F) transfected KYSE-150 cells. (G and H) Heatmap showed the DEGs in siRNA-AHNAK2 (G) and siRNA-EVPL (H) transfected KYSE-150 cells.

