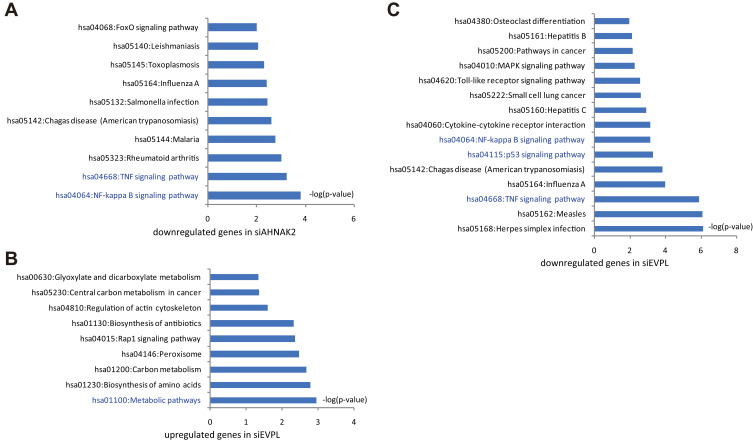
Figure 5.
DAVID-KEGG analyses of siRNA-AHNAK2 and siRNA-EVPL transfected KYSE-150 cells. (A) DAVID-KEGG analysis of the downregulated genes in siRNA-AHNAK2 transfected KYSE-150 cells, p-value < 0.01. (B) DAVID-KEGG analysis of the upregulated genes in siRNA-EVPL transfected KYSE-150 cells, p-value < 0.01. (C) DAVID-KEGG analysis of the downregulated genes in siRNA-EVPL transfected KYSE-150 cells, p-value < 0.01.

