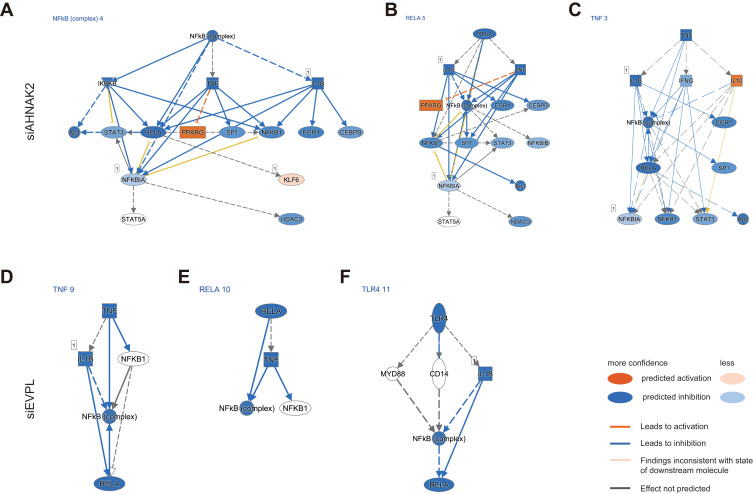
Figure 7.
IPA upstream analyses of siRNA-AHNAK2 and siRNA-EVPL transfected KYSE-150 cells. (A–C) IPA upstream analyses of siRNA-AHNAK2 transfected KYSE-150 cells, including the NF-κB signaling (A), RELA signaling (B) and TNF signaling (C). (D–F) IPA upstream analyses of siRNA-EVPL transfected KYSE-150 cells, including the TNF signaling (D), RELA signaling (E) and TLR4 signaling (F). Blue color shows predicted inhibition, while orange color shows predicted activation.

