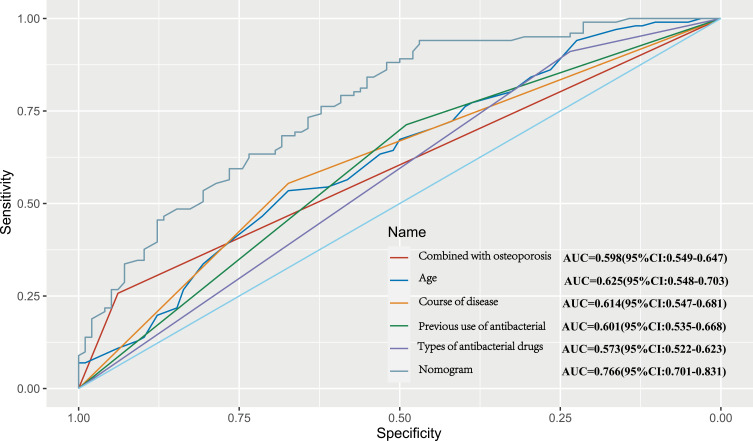
Figure 4.
ROC curve analysis of different indicators.
Notes: The Y-axis indicates the sensitivity of the nomogram while the X-axis indicates the specificity of the nomogram. The AUC of the nomogram in predicting the probability of the MDRB infection in a patient was higher than any single indicator.
Abbreviations: ROC, receiver operating characteristic; AUC, area under curve; MDRB, multidrug-resistant bacteria.

