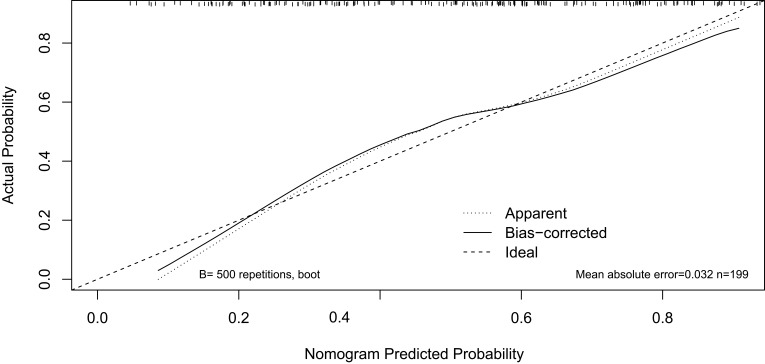
Figure 6.
Calibration curve analysis of nomogram model after internal verification.
Notes: The Y-axis indicates the actual probability of the patient’s MDRB infection and the X-axis indicates the predicted probability of the patient’s MDRB infection. The 45-degree black dotted line represents the ideal prediction; the solid black line surrounding the 45-degree black dotted line represents the bias-corrected prediction; the black dotted line surrounding the 45-degree black dotted line represents the apparent prediction.
Abbreviation: MDRB, multidrug-resistant bacteria.

