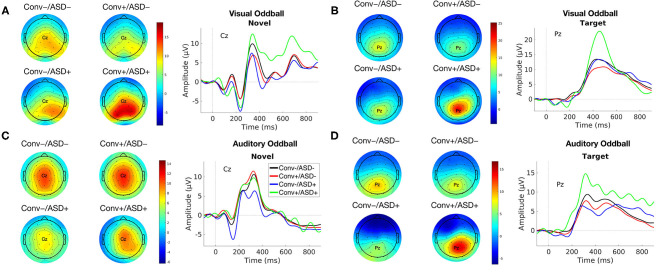
Figure 1.
Group average ERP waveforms for modality [Visual (A,B) and Auditory (C,D)] and Stimulus Type [Novel (A,C) and Target (B,D)] for Conv–/ASD– (black), Conv–/ASD+ (blue), Conv+/ASD– (red), and Conv+/ASD+ (green). Stimulus onset occurred at 0 ms. Scalp topographic maps of the mean P3a/P3b amplitude in response to the Target/Novel stimulus type around the mean latency ± 10 ms.

