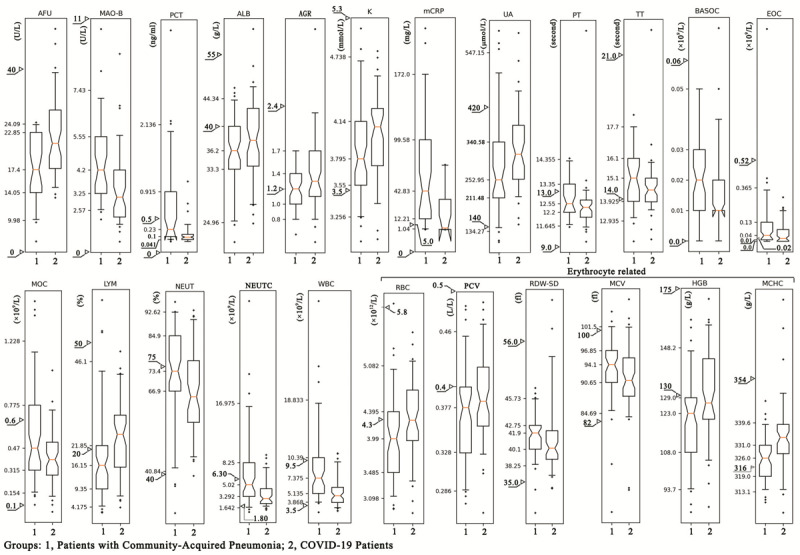
Figure 1.

The statistical distribution of the plasma level of the clinical laboratory indicators (CLIs) with a remarkable difference between COVID-19 and community-acquired pneumonia (CAP). The statistical distribution was presented with a box and whisker plot. The horizontal lines within the boxes indicate the median value. The vertical lines extending below and above the boxes represent 5%-95% percentile values. The scale on the y-axis represents the values of the 5th, 25th, 50th, 75th, and 95th percentiles of the CLI in the CAP group. The triangles represent the upper and lower limits of the normal reference range of the laboratory index. AFU: α-L-fucosidase; AGR: albumin to globulin ratio; ALB: albumin; BASOC: basophil count; EOC: eosinophil count; HGB: hemoglobin concentration; K: potassium; LYM: lymphocyte; MAO-B: monoaminoxidase B; MCHC: mean corpuscular hemoglobin concentration; mCRP: micro–C-reactive protein; MCV: mean (red blood cell) corpuscular volume; MOC: monocyte count; NEUT: neutrophil ratio; NEUTC: neutrophil count; PCT: procalcitonin; PCV: packed-cell volume (hematocrit); PT: prothrombin time; RBC: red blood cell count; RDW-SD: red blood cell distribution width–standard deviation; TT: thrombin time; UA: uric acid; WBC: white blood cell count.
