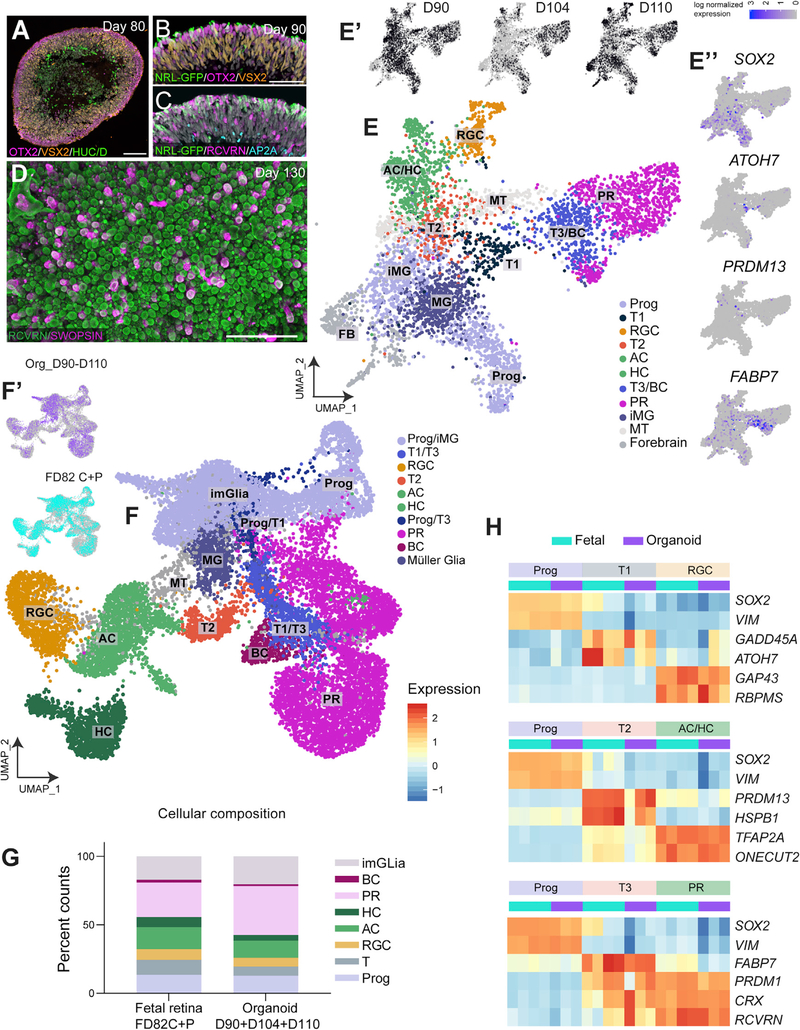
Figure 5. scRNAseq of D100 Retinal Organoids.
(A) D80 organoids contain a PR layer (OTX2, magenta), an NBL (VSX2, orange), and HUC/D+ ganglion cells and ACs (green).
(B and C) Early rods (NRL-GFP) at 90 days of differentiation, along with progenitors (VSX2+) (B) and ACs (AP2A+) (C).
(D) Whole-mount staining at day 130 shows RCVRN+ cone PRs (green), some of which express SWS-OPN (magenta).
(E) UMAP clusters highlighting the cellular composition at this age.
(E’) scRNA-seq analysis of D90, D104, and D110 organoids plotted by origin.
(E”) Feature plots showing Prog and transition cell populations.
(F and F’) Combined scRNA-seq analysis of fetal retina and organoids; FD82 central and periphery (FD82C+P) with organoids (D90, D104, and D110). (F0) shows the composition by origin (organoid, purple; fetal retina, cyan), and (F) shows the UMAP clusters seen at this age.
(G) Stacked plots showing the percent counts from (F), reflecting the composition of the fetal retina and organoids from (F). Counts were calculated for eachdataset and then averaged by fetal or organoid.
(H) Heatmaps plotting the cluster averages of key genes, highlighting the 3 lineages seen at this age. Each column corresponds to a single dataset (cyan, FD82C;P [purple], day 90, day 104, and day 110 organoids).
Scale bars,50μm.. FB, forebrain; MT, mitochondrial cluster.

