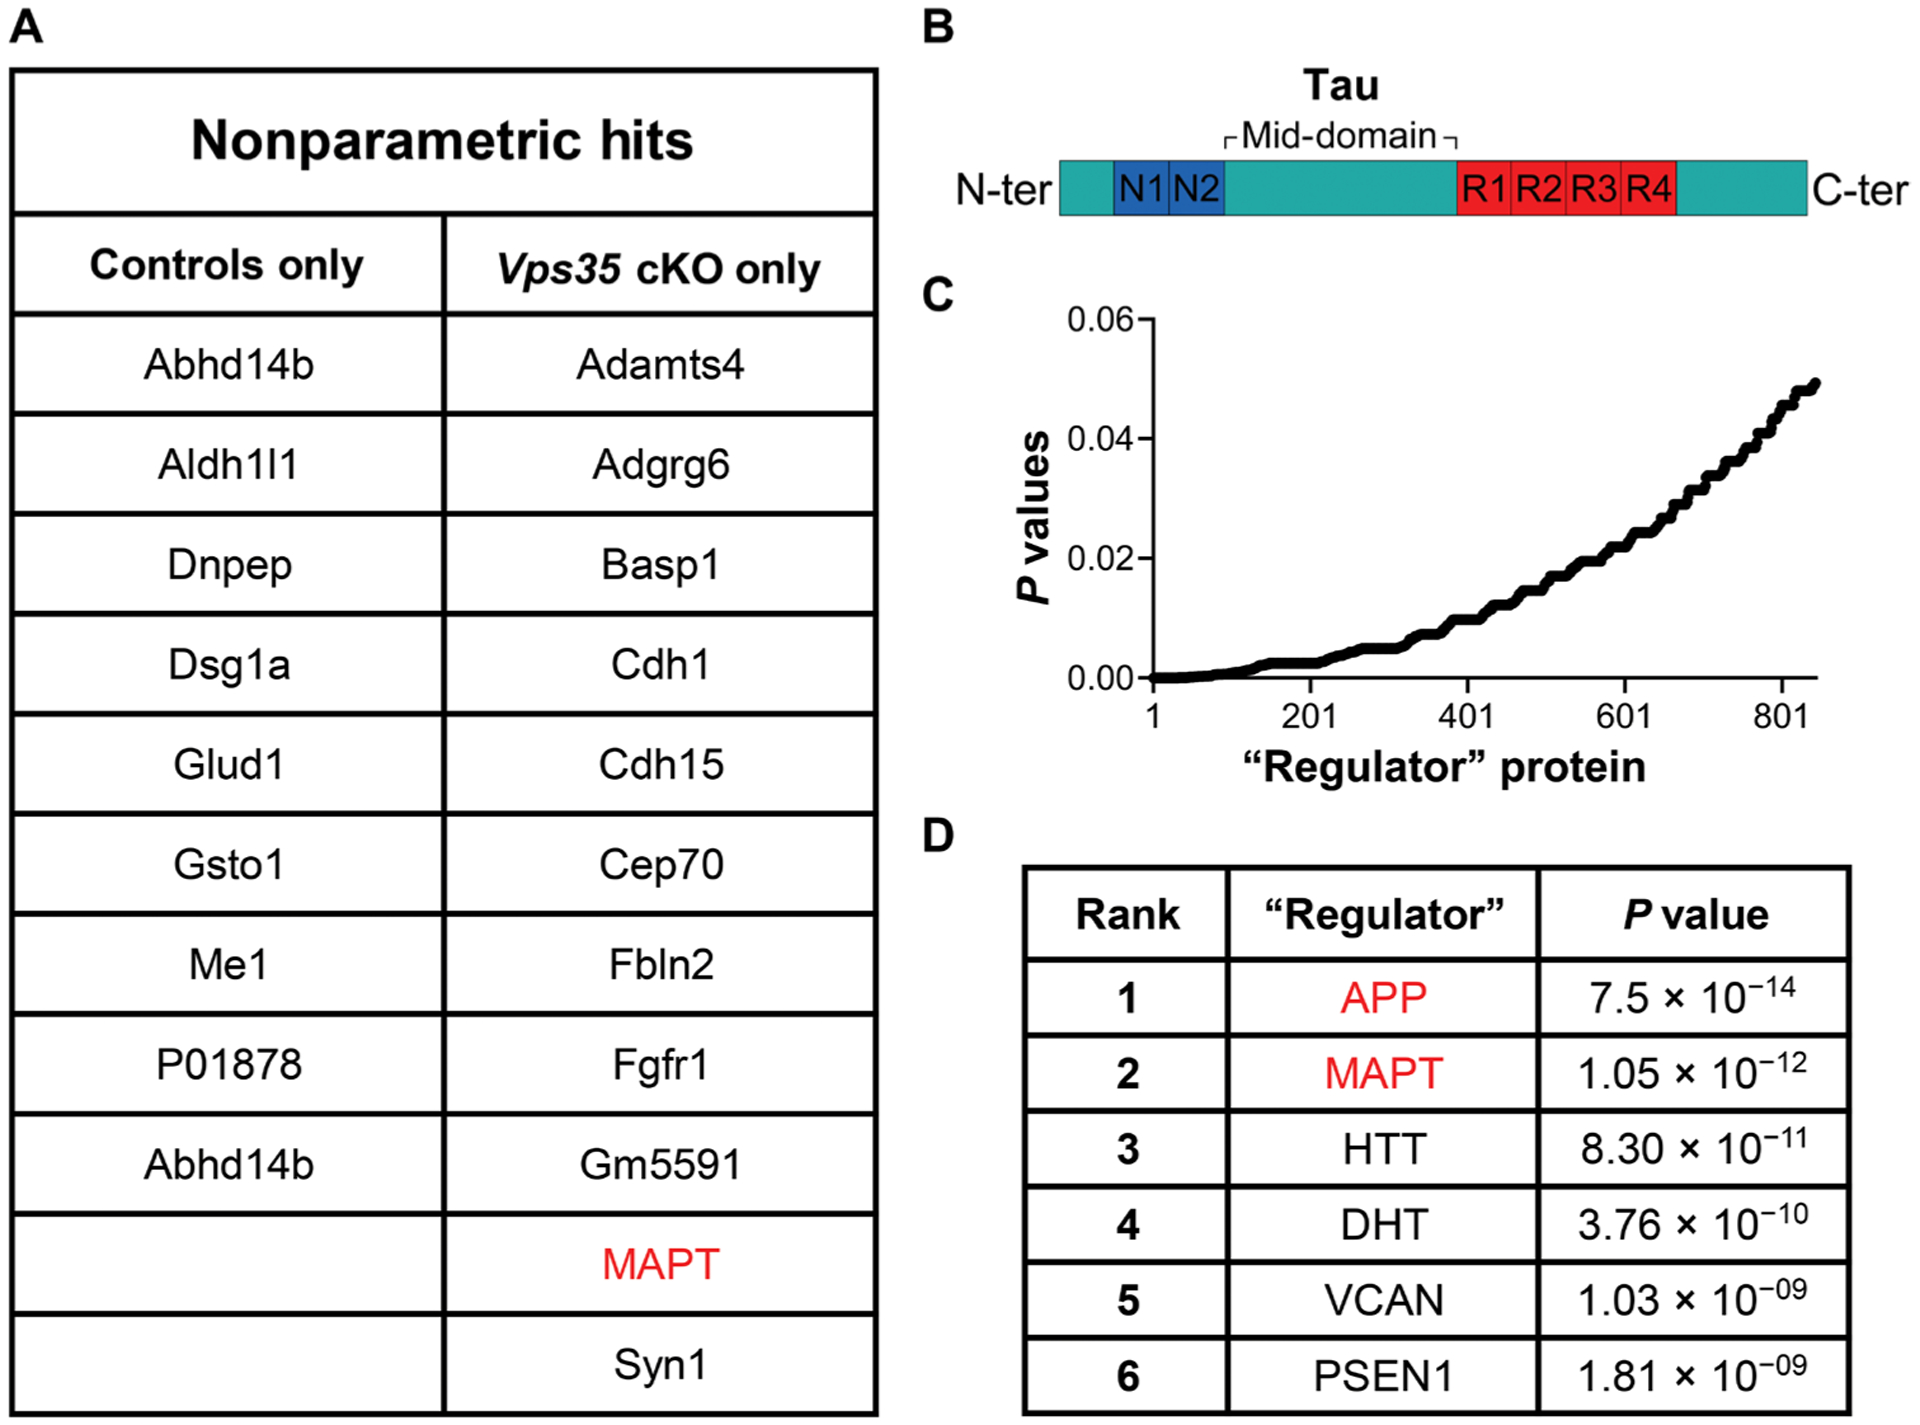
Fig. 3. Nonparametric and pathway analysis of CSF proteomic abnormalities caused by Vps35 depletion.

(A) Listed proteins are those detected only in the controls or in the Vps35 cKO mice, with microtubule-associated protein tau (MAPT) indicated in red. (B) Tau protein structural features are shown in the linear diagram. Peptide region identified by MS/MS is indicated with an arrow. (C) Scatterplot shows the P value distribution of over 800 proteins identified by pathway analysis as “regulator” proteins. (D) Listed proteins are the top six regulators, with lowest P values.
