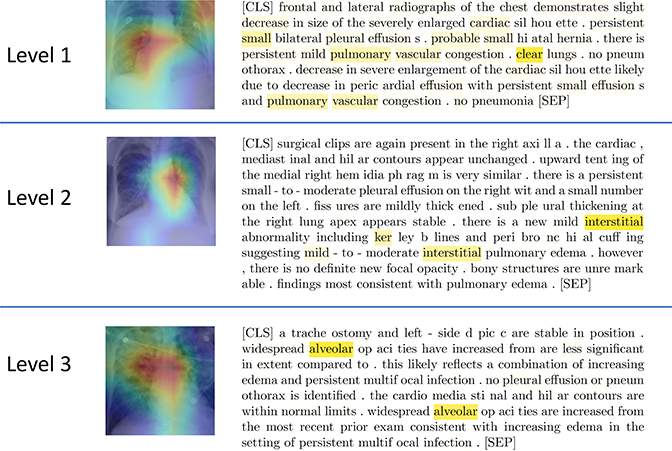
Fig. 2:
Joint model visualization. Top to bottoni: (Level 1) The lhghlight of the Grad-CAM image is centered around the right hilar region, which is consistent with findings in pulmonary vascular congestion as shown in the report. (Level 2) The lhghlight of the Grad-CAM image is centered around the left hilar region which shows radiating interstitial markings as confirmed by the report heatmap. (Level 3) Grad-CAM liighlights bilateral alveolar opacities radiating out from the hila and sparing the outer lungs. This pattern is classically described as “batwing” pulmonary edema mentioned in the report. The report text is presented in the form of sub-word tokenization performed by the BERT model, starting the report with a [CLS] token and ending with a [SEP].

