FIGURE 2.

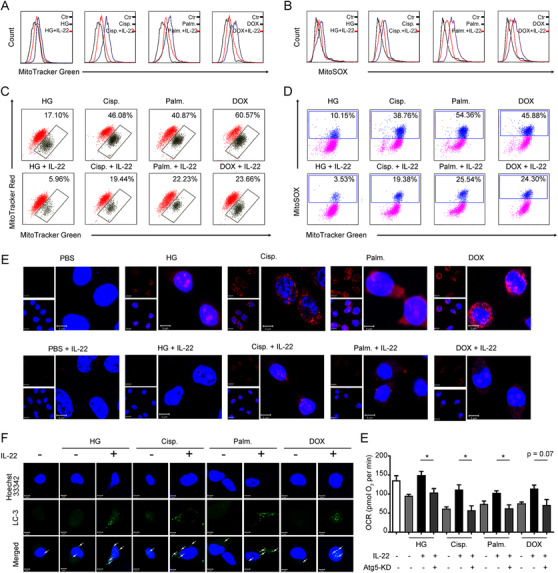
IL‐22 inhibits mitochondrial dysfunction and mitochondrial ROS accumulation via the induction of mitophagy. (A) Mitochondrial mass was stained and assessed by MitoTracker Green and flow cytometry. Mitochondrial ROS was evaluated in TECs stained with MitoSOX (B). Mitochondrial membrane potential was assessed in TECs stained with MitoTracker Green and MitoTracker Red (C); mitochondrial ROS accumulation was evaluated by MitoTracker Green and MitoSOX (D). (E) Confocal image results suggested mitochondrial ROS production labeled with MitoSOX. (F) Representative microscopic images indicated LC3‐GFP punctate formation in the presence or absence of IL‐22 TECs stimulated as (A) for 24 h. (E) OCR was assessed in the presence or absence of IL‐22 and siRNA‐ATG5 for 24 h. n = 3; Student's t‐test (unpaired); ***p < 0.001, **p < 0.01, *p < 0.05
