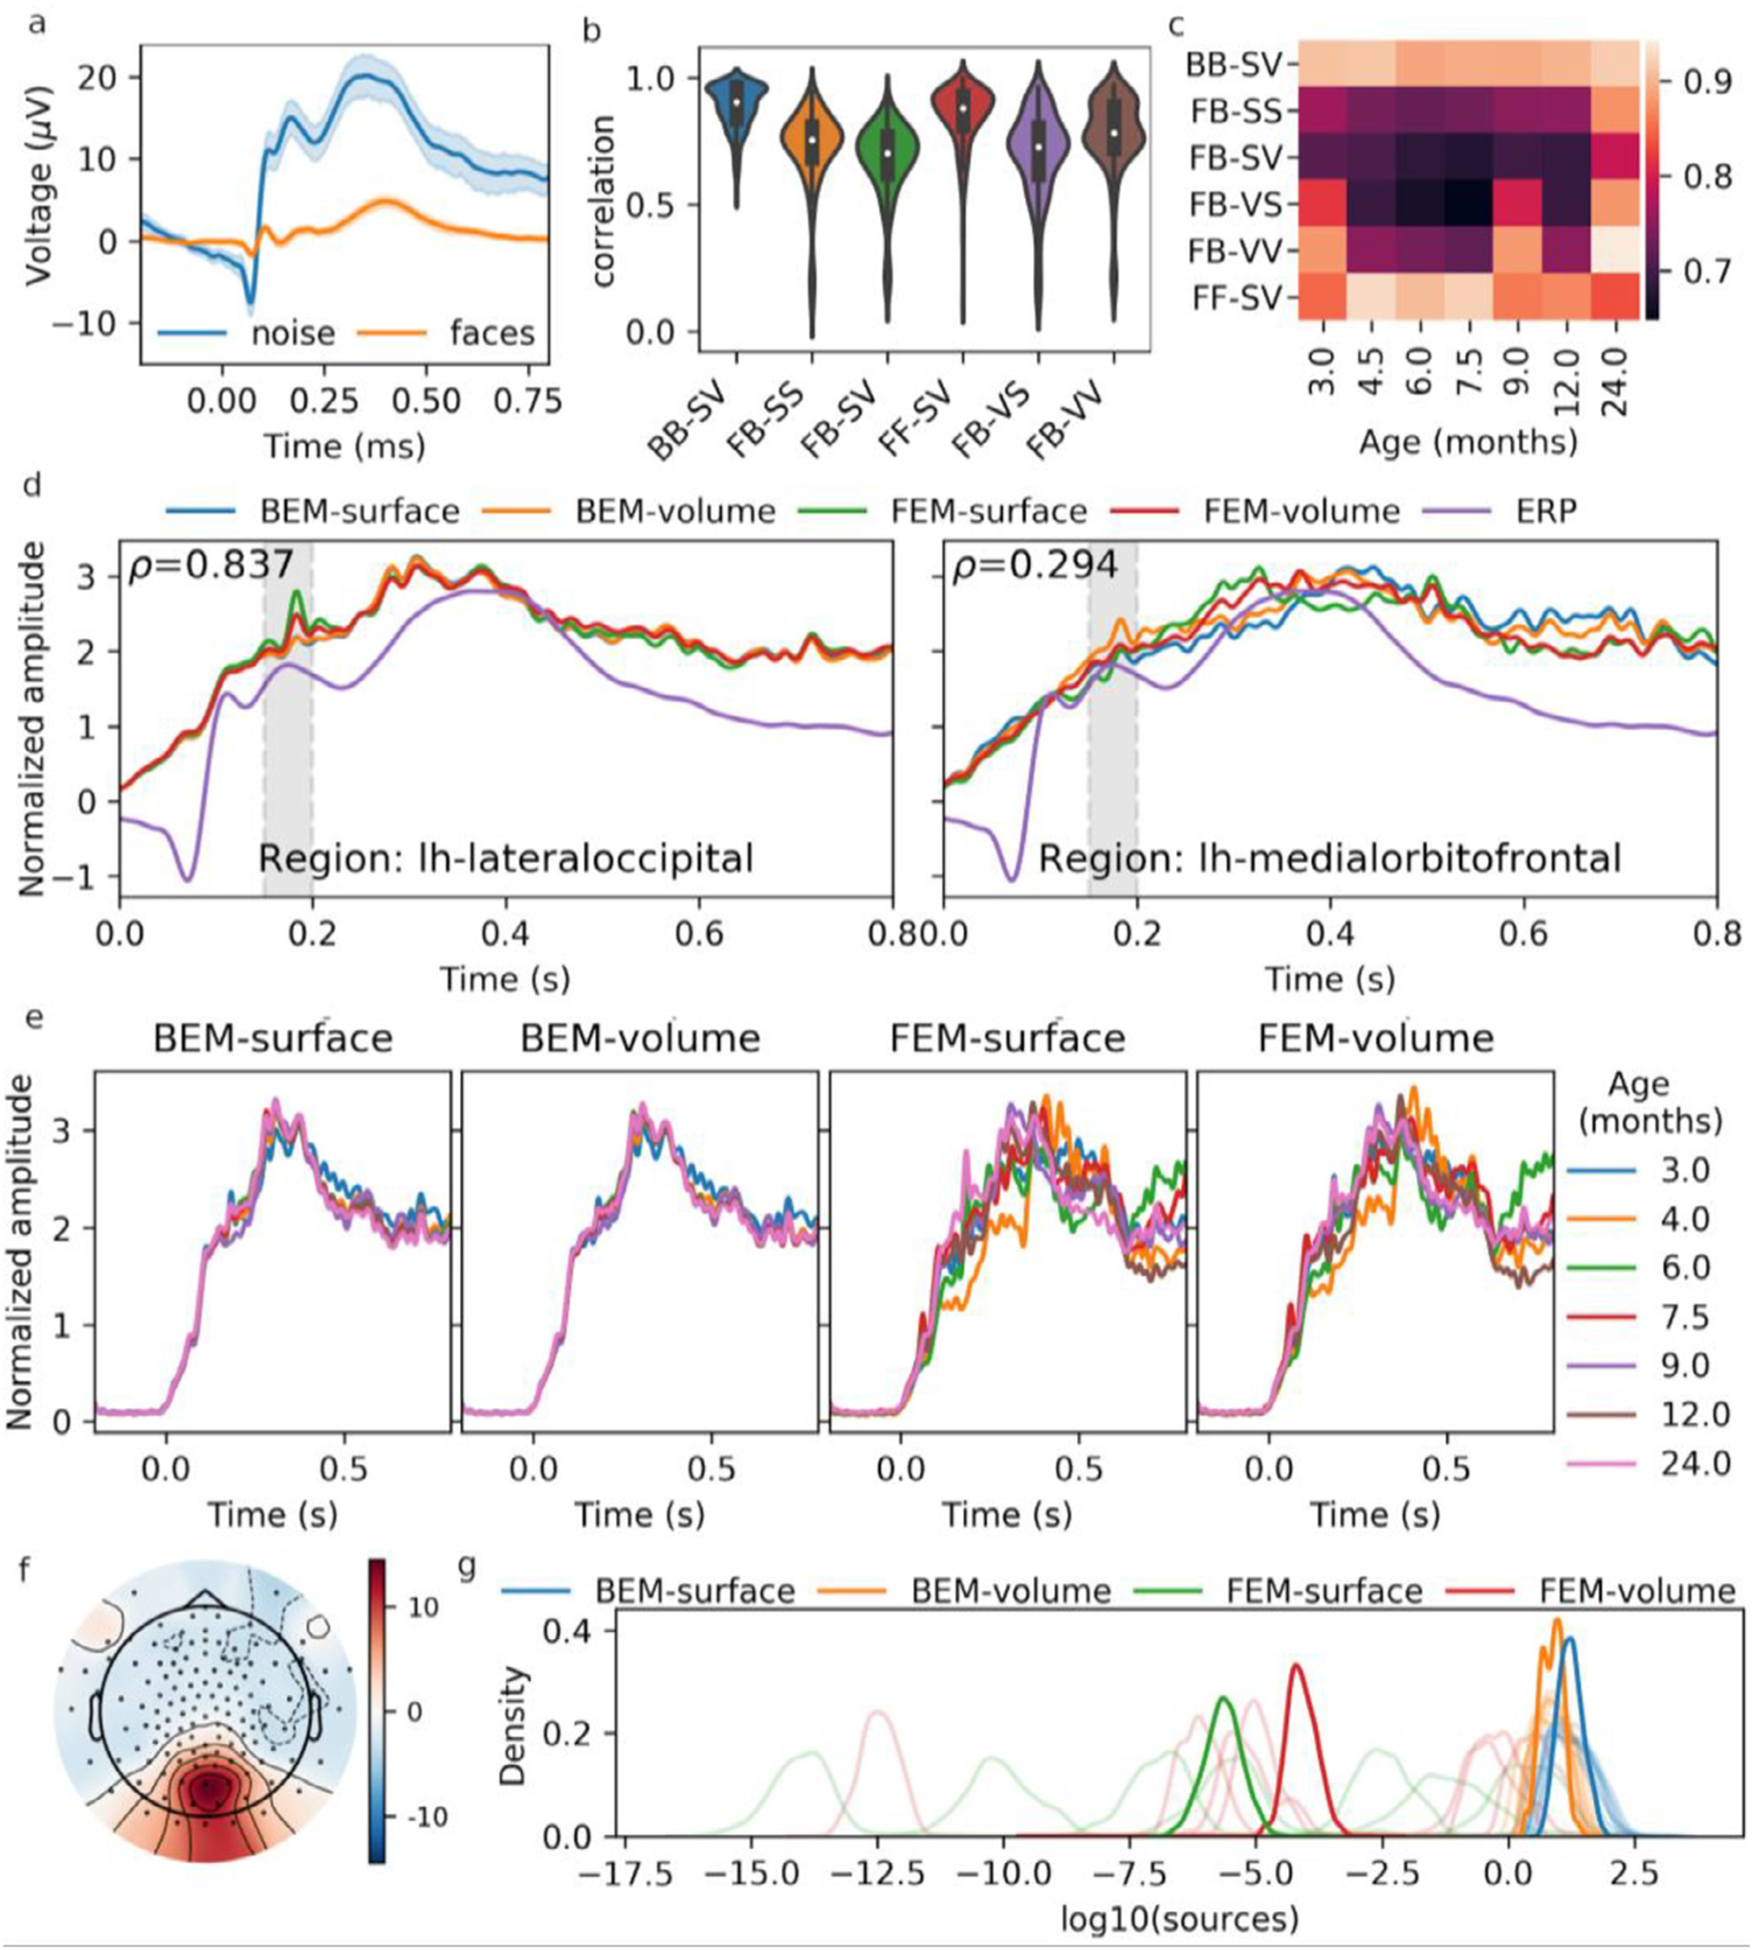
Fig. 3.

a) ERP for the “noise” and the “face” conditions, averaged across epochs and subjects, for the E75/Oz channel. b) Distribution of the correlation of brain region ERSP between pairs of models. Model comparisons are labeled as H1 H2 -S1 S2, where H1 and H2 represent the two head models and S1 and S2 represent the two source models, with the models being identified with the following shorthand notations: F: FEM, B: BEM, S: surface, V: volume. c) Median (across brain regions) correlation between pairs of models, for each template separately. d) ERSP for the regions which show the highest and the lowest correlation for the FB-SV model comparison. The ERP (channel E75/Oz) is also overlaid on this plot. The average of the activity within the grayed window (150–200 ms) is used for the subsequent panels and for source distributions in Fig. 4. e) Similar to the right part of panel d, this panel shows ERSP for the regions with the highest correlation for the FB-SV model comparison, but illustrate the ERSP separately for the different templates. g) Topomap of the scalp ERP. h) Distribution of time-averaged ERSP for the four models. Light-colored lines show the distribution for the different templates, whereas the darker colors show the distribution after averaging across templates.
