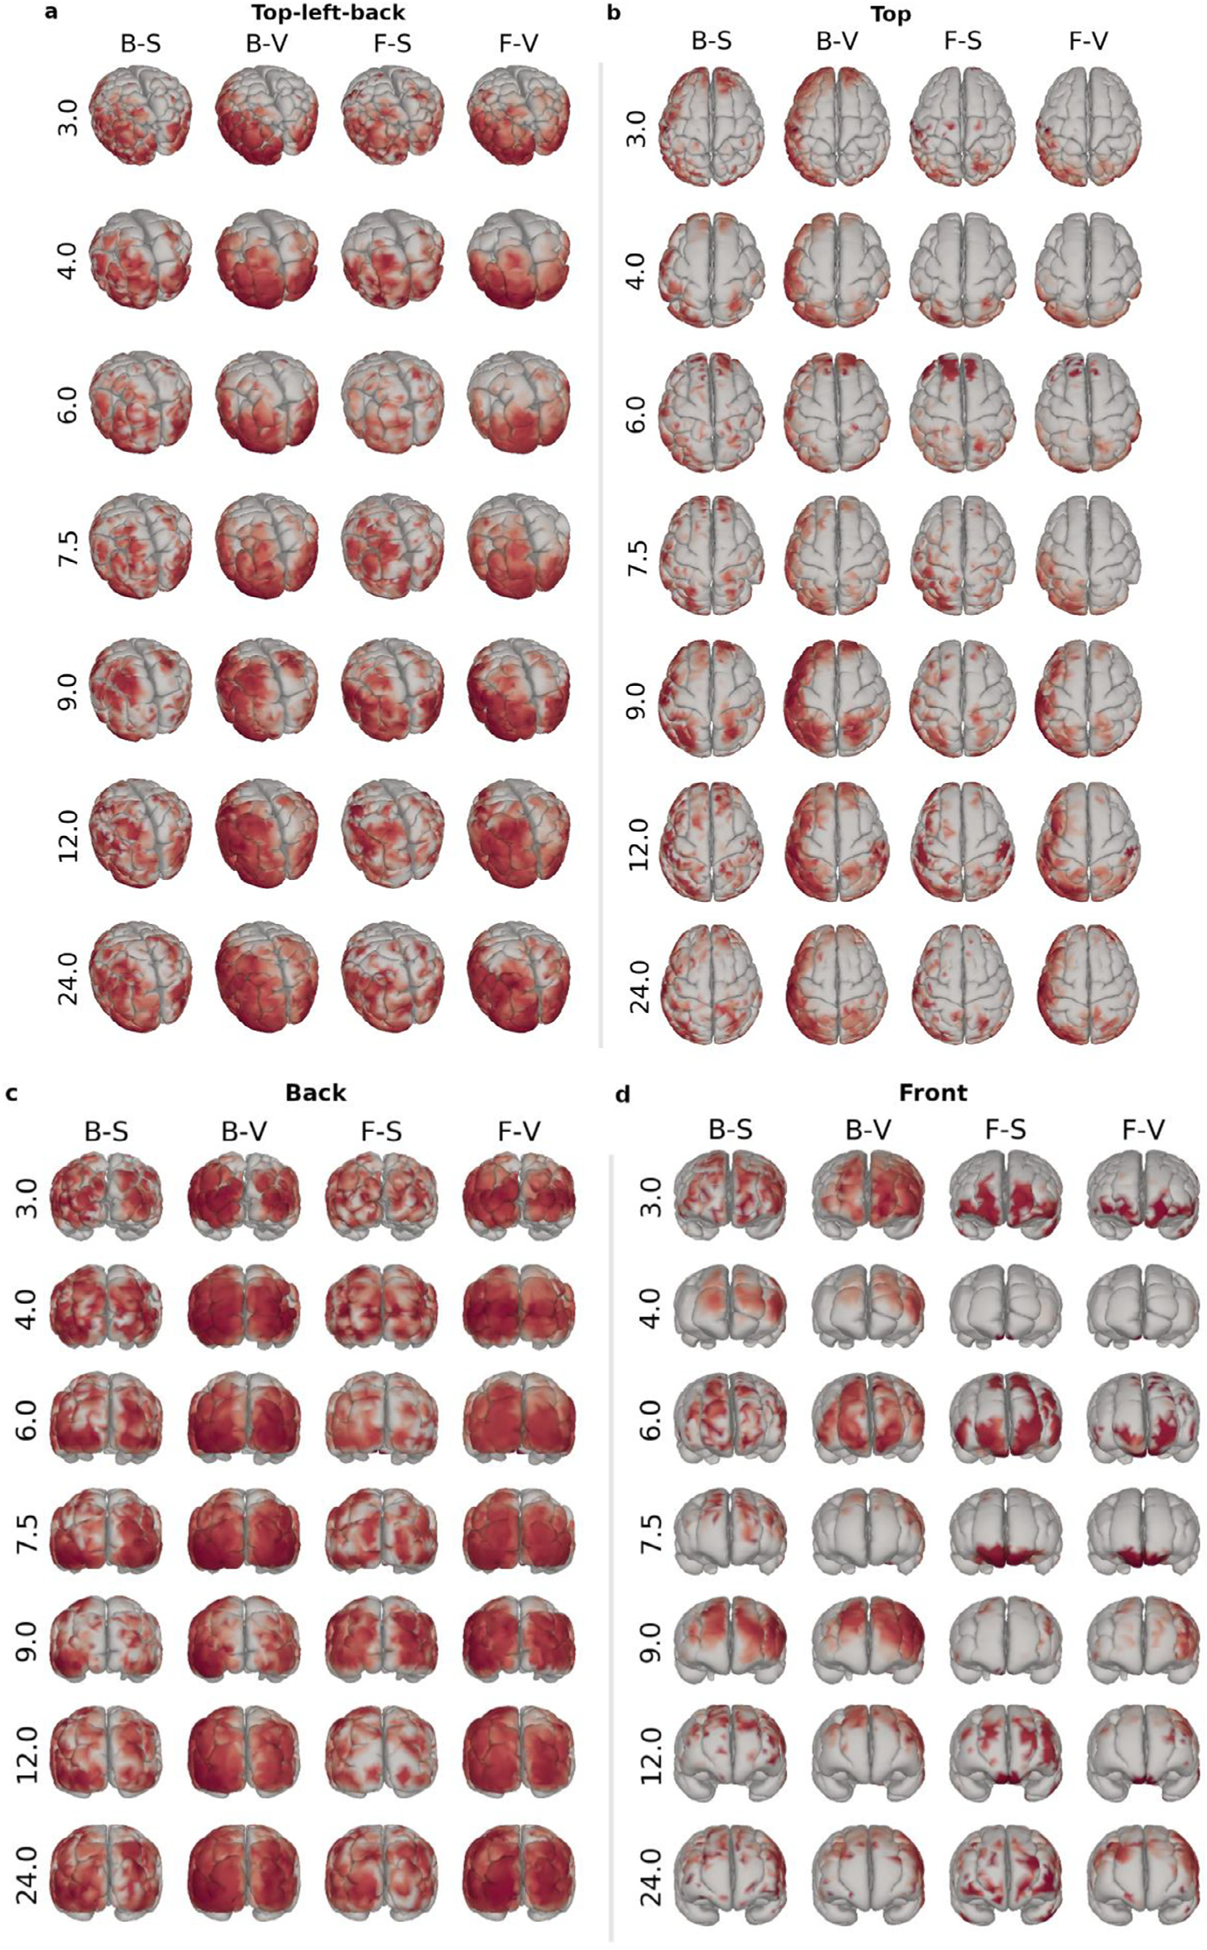
Fig. 4.

Spatial source distributions for the different models (columns) and templates (rows) shown from different views (panels a-d). The models are coded as H-S, where H represents the head model and S represents the source model, with models identified with the following shorthand notations: F: FEM, B: BEM, S: surface, and V: volume. The values at the right of each row indicate the template age, in months. Identical data are shown in different views from top-left-back (a), top (b), back (c), and front (d). Sources with larger amplitude than the 75th percentile are color-coded linearly according to the percentile, from transparent (75th percentile) to dark red (100th percentile).
