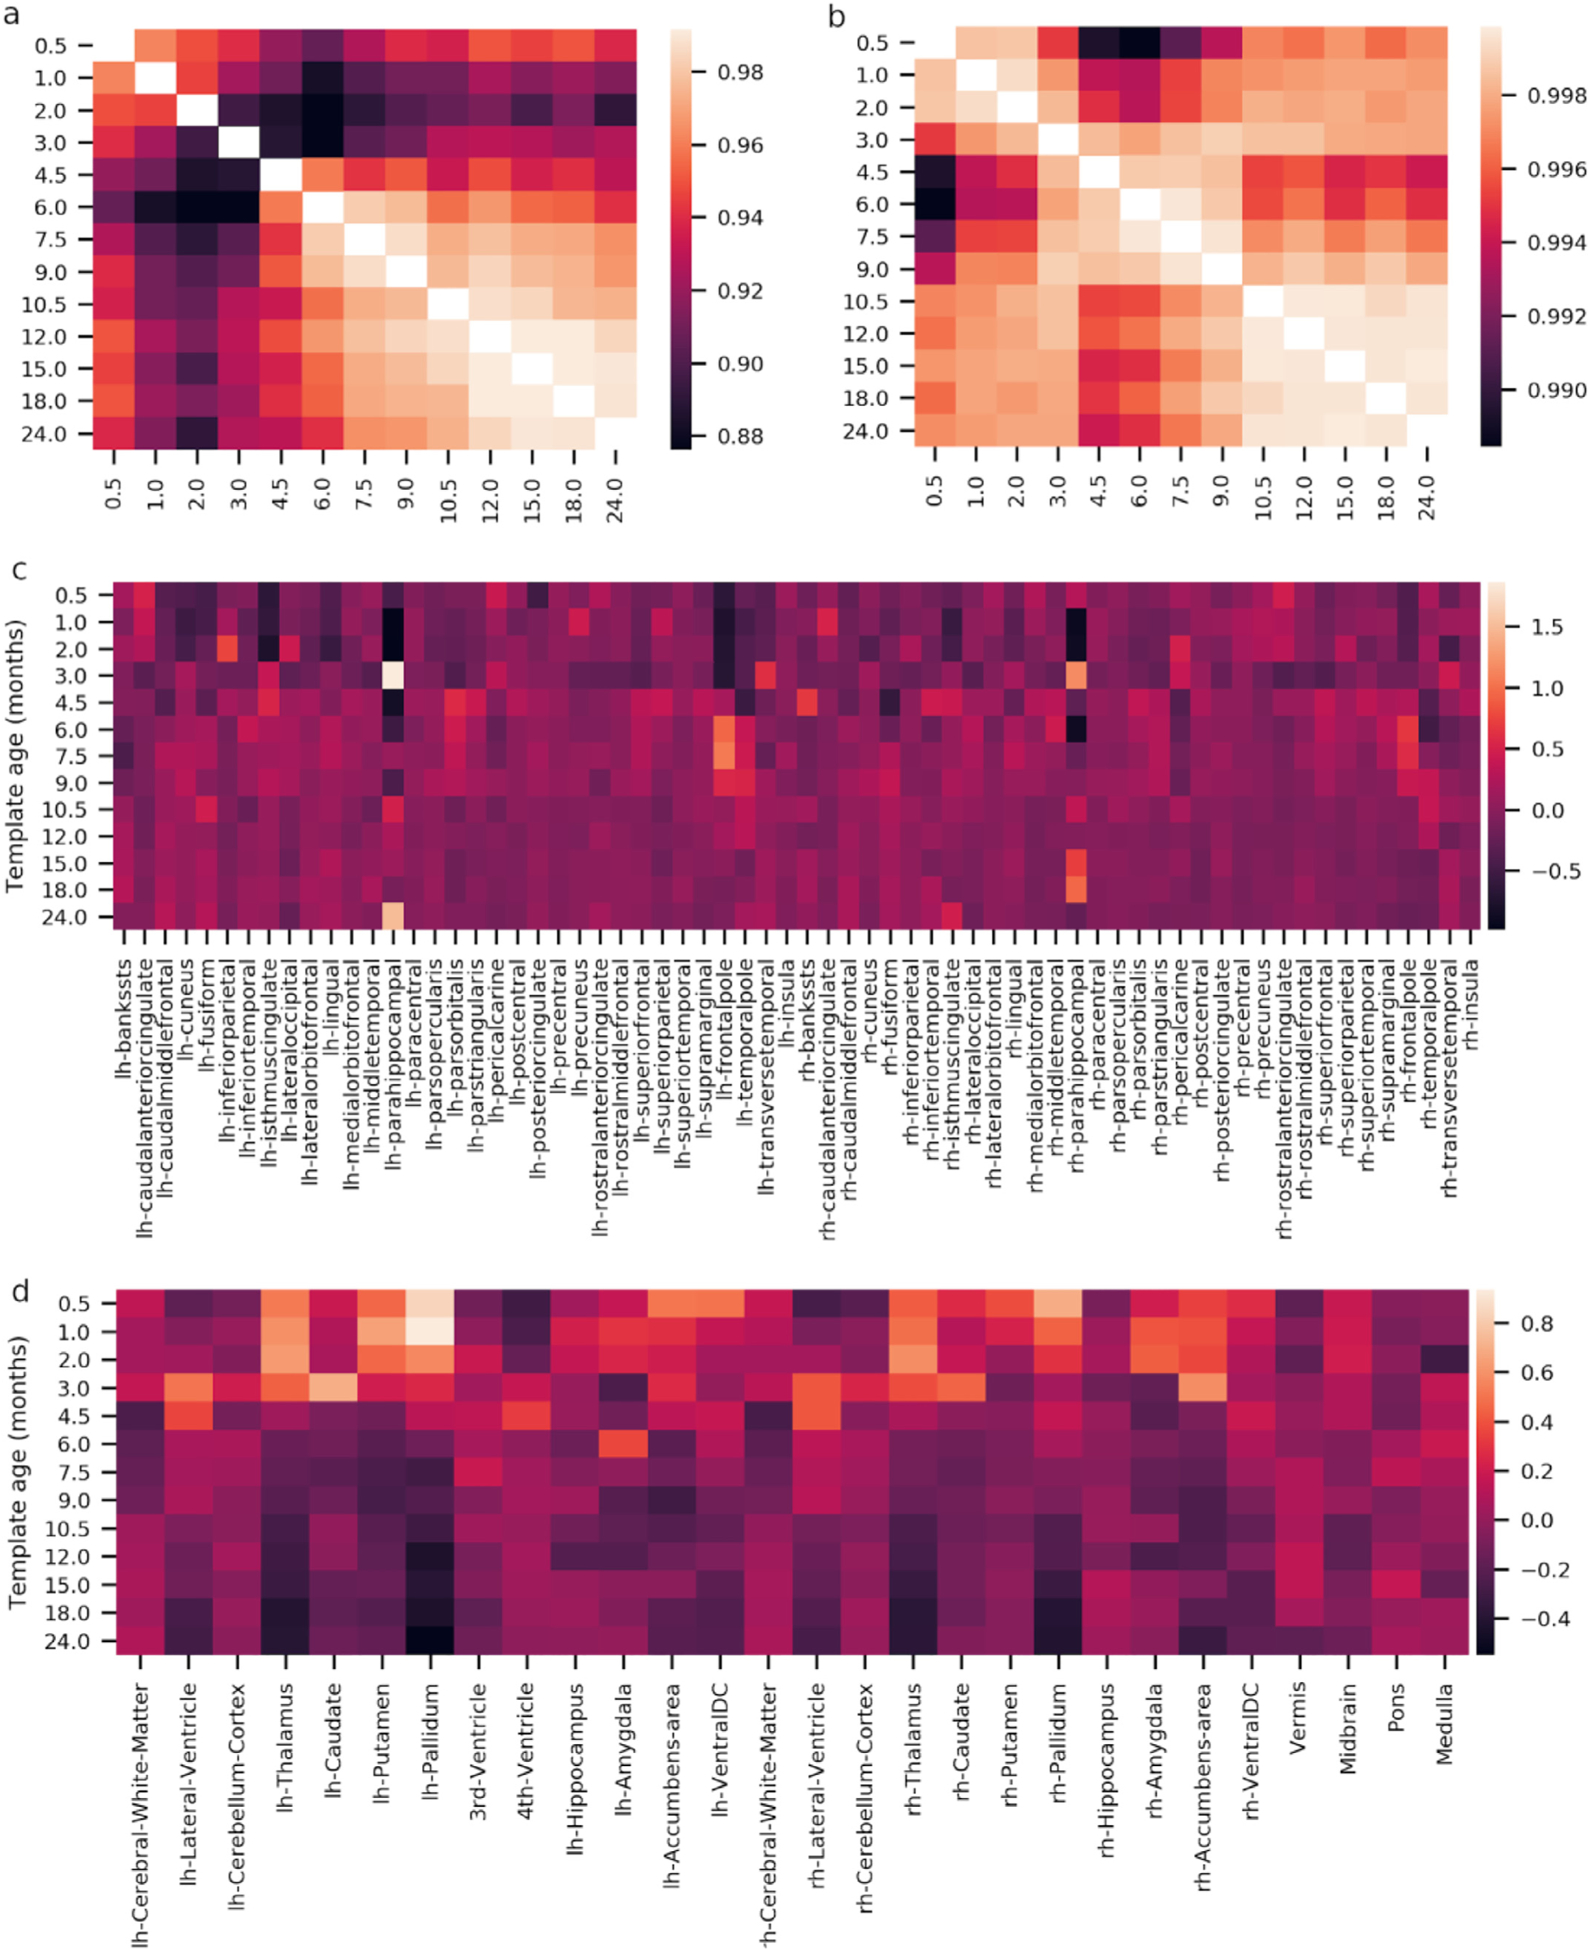
Fig. 5.

Structural validation of the surface templates. a,b) Correlation of the relative volume νr of cortical (a) and subcortical (b) regions between templates. Note that the lower end of the correlation colorbar is greater than 0.998. c,d) Relative differences between a template νr and the across-template averages (νr) for cortical (c) and subcortical (d) regions.
