Fig. 6.

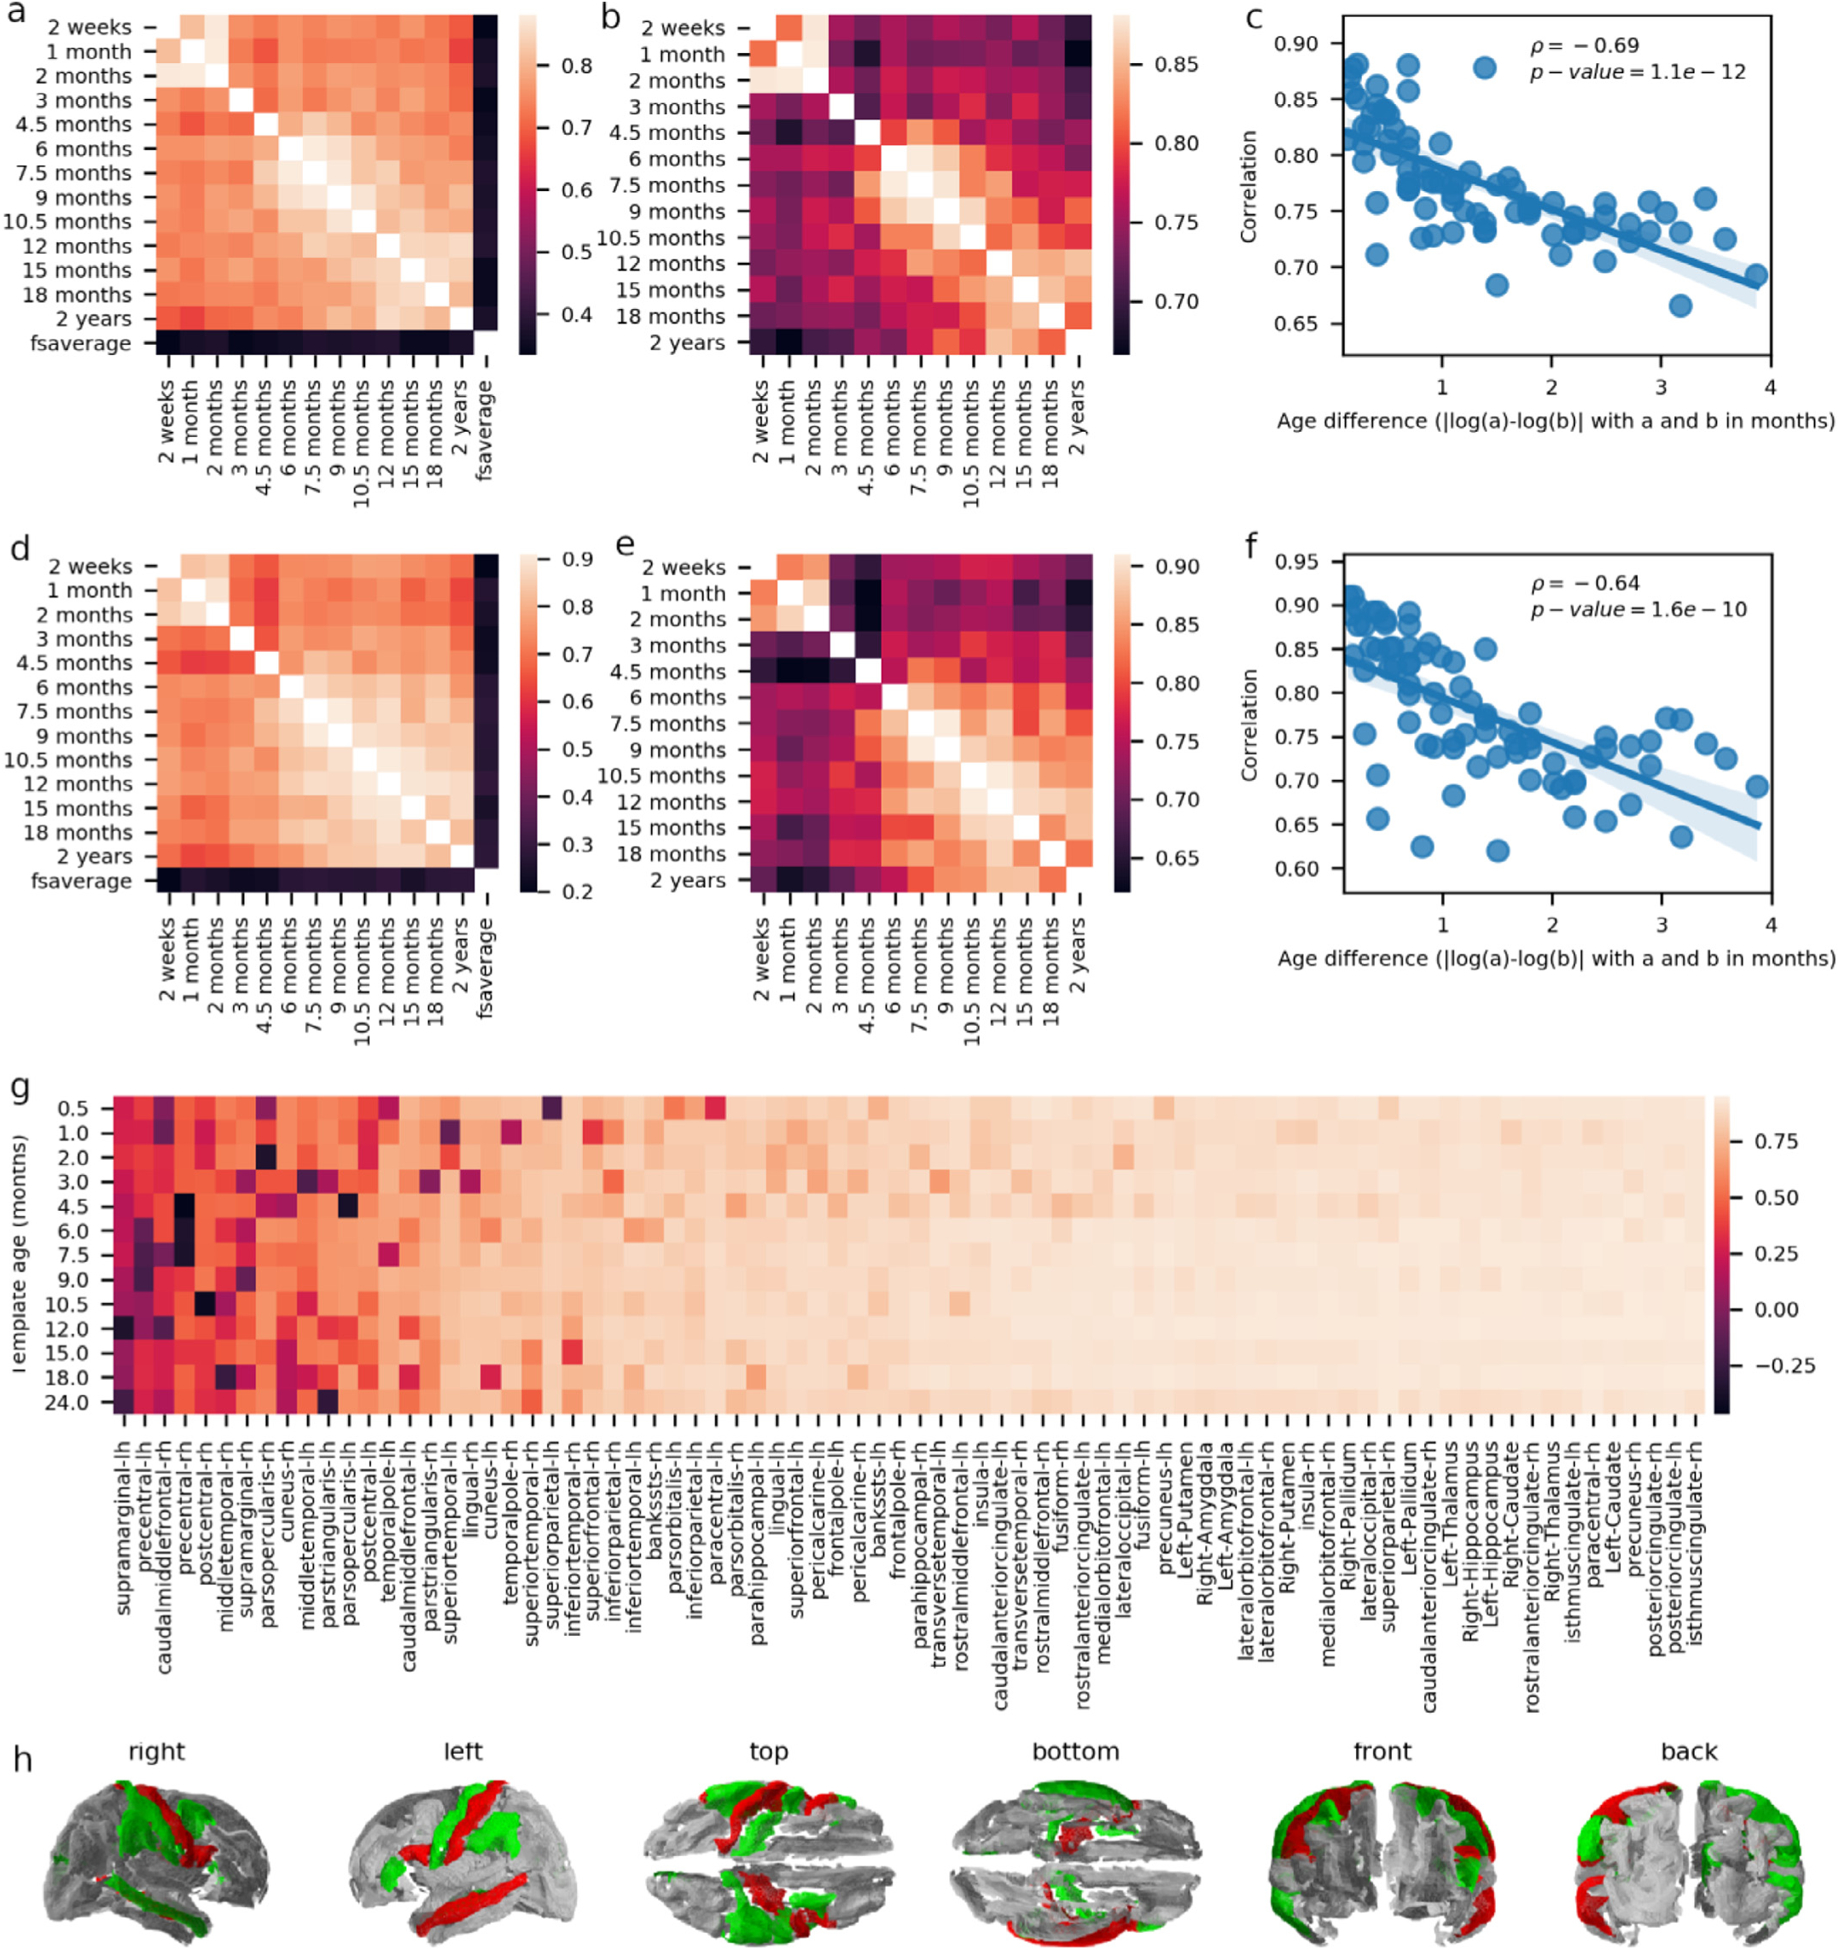
a) Average correlations between the ERSP time-series computed from different templates. b) As in a, but excluding the fsaverage template and adjusting the scale to emphasize the pattern of variation between the infant templates. c) Average correlations (as computed for panels a and b) as a function of the log-transformed age difference between templates. d-f) Similar as for panels a-c, but reporting Pearson correlation coefficients across brain regions instead of time. g) Average ERSP time-series correlation computed separately for every region and averaged for each template separately. h) Cortical representation showing average time-series correlation (mean values per column of panel g) lower than 0.6 colored in red or green, depending on whether they show (red) or not (green) the typical decrease in correlations with increasing age differences.
