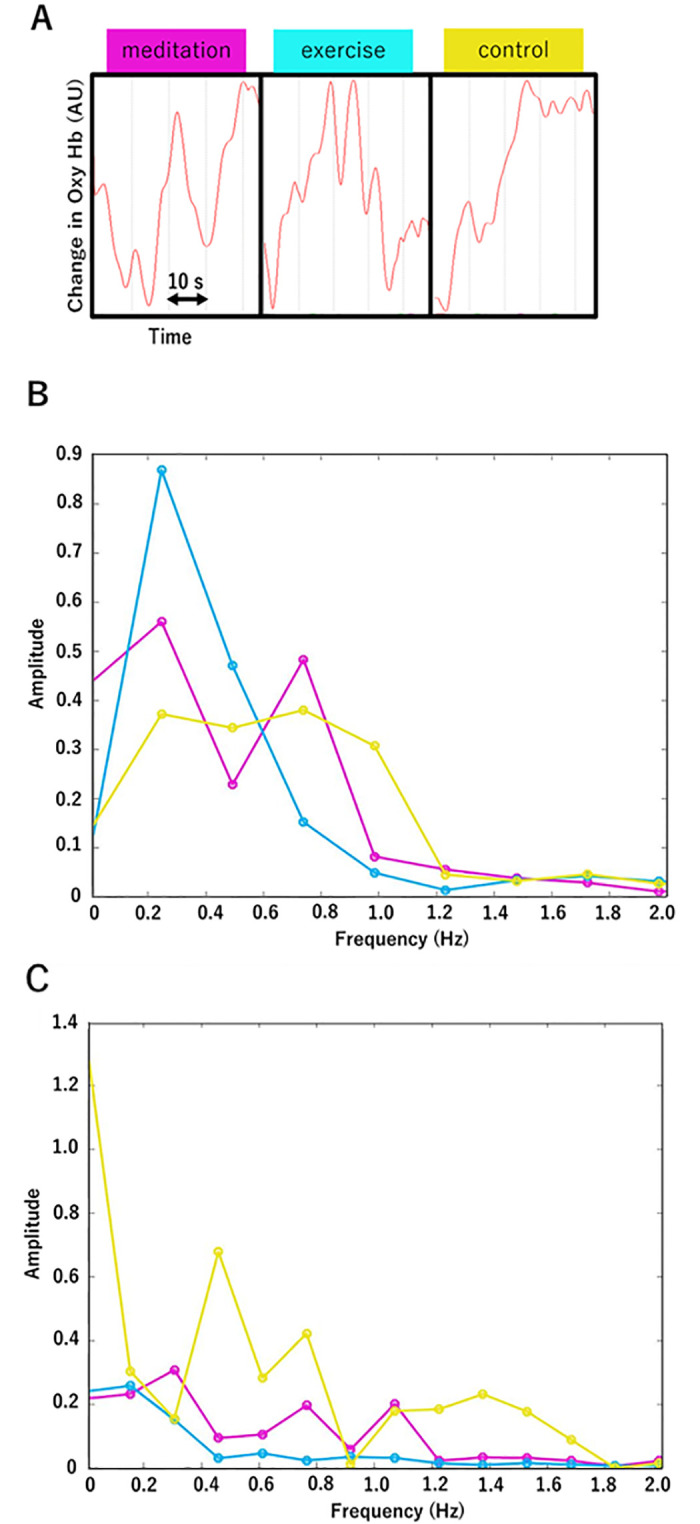
Fig 4. Representative NIRS signals and their FFT data.

A. At CH14 in a participant, the oxyhemoglobin NIRS signals (red lines) were obtained during the 2-back tests after meditation, exercise, and a control task. These figures show only typical signal changes as examples. B. FFT values calculated from the data of a left-handed participant. C. FFT values calculated from the data of a right-handed participant. Red line indicates the meditation data; blue line indicates those of exercise; and yellow line indicates those of control.
