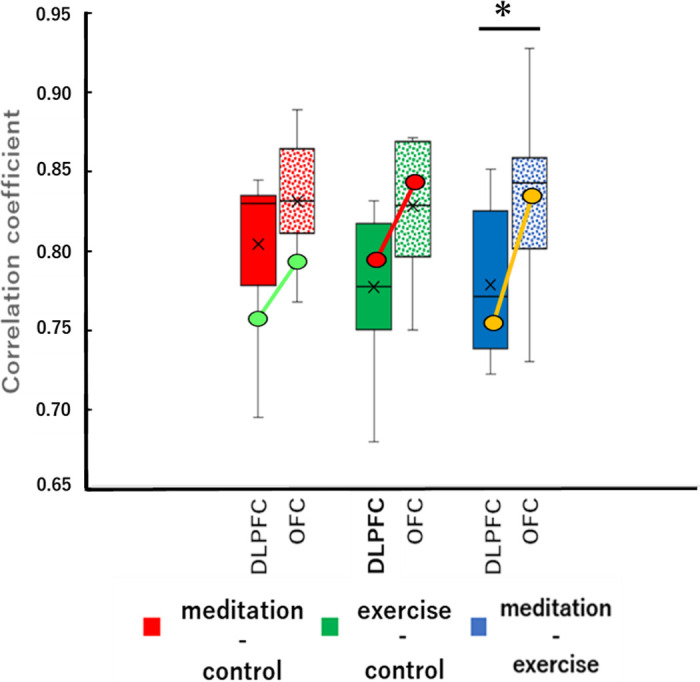
Fig 5. Correlation coefficients of the FFT-analyzed NIRS frequency at the DLPFC and the OFC for the meditation-control pair (red), the exercise-control pair (green), and the meditation-exercise pair (blue).

A Mann-Whitney U-test was performed after an F test for equal variance. *p < 0.05. The diagonal lines show the changes in mean values obtained from the 2 left-handed participants.
