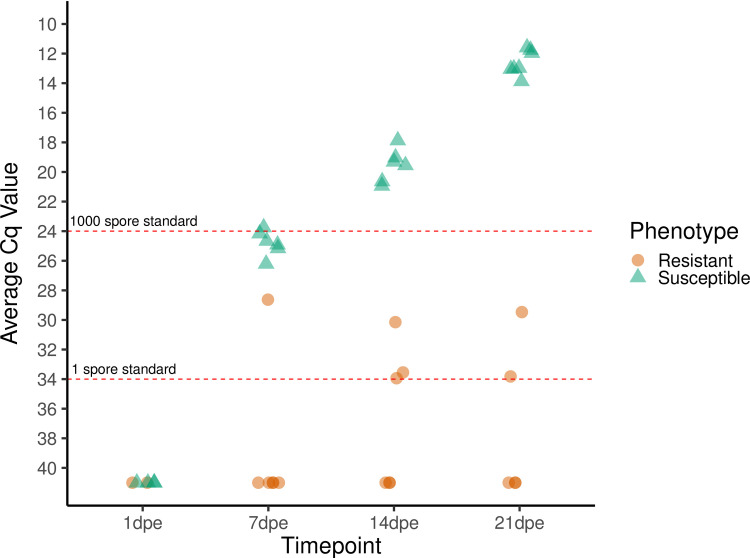
Fig 3. Relative quantity of Ceratonova shasta DNA present in the gills (1 dpe) and intestine (7, 14, and 21 dpe) of infected steelhead (Oncorhynchus mykiss).
Each symbol represents the average quantitative cycle (Cq) of 100 ng of DNA extracted from the whole tissue (gills or intestine) of one fish that was assayed in triplicate by qPCR. Six fish of each phenotype were assayed at each timepoint. Fish that tested negative were assigned a nominal Cq value of 41. Dashed red lines indicate the average Cq values obtained from 1 and 1000 actinospore standards.

