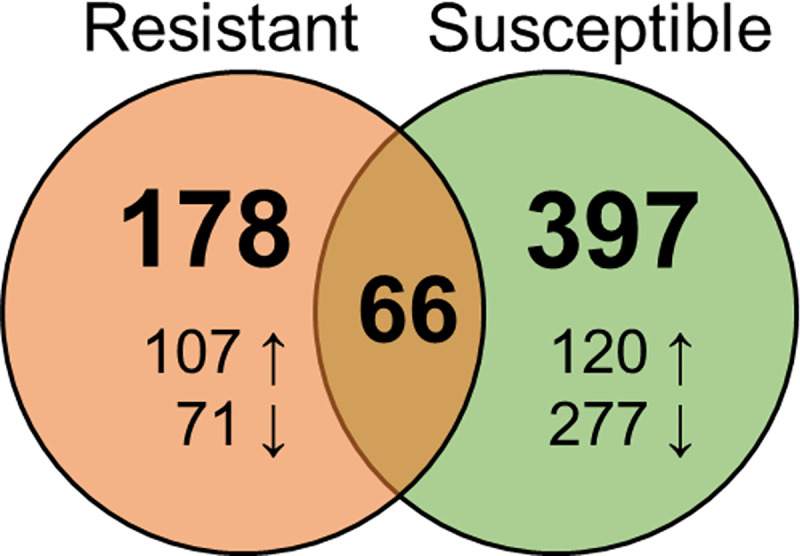
Fig 4. Venn Diagram showing the number of genes differentially expressed in response to Ceratonova shasta infection in the gills of resistant and susceptible steelhead at 1 day post exposure.

Arrows indicate upregulation vs downregulation.

Arrows indicate upregulation vs downregulation.