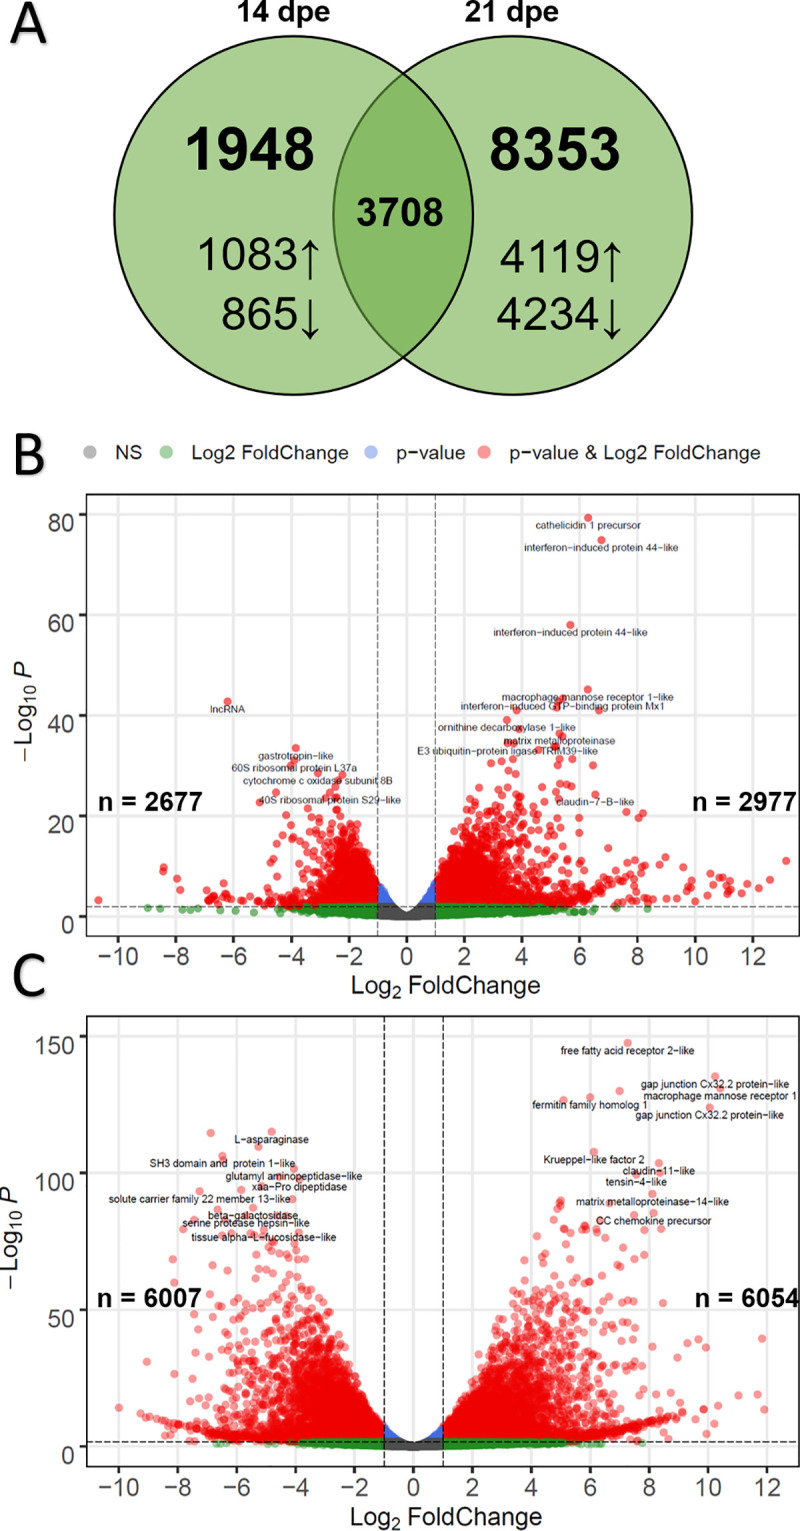
Fig 6. Differential expression results for susceptible fish at 14- and 21-days post exposure (dpe) to Ceratonova shasta.

A) Venn diagram indicating the number of differentially expressed genes overlapping at 14- and 21 dpe. Arrows indicate up- vs. downregulation. B) Volcano plot of differential gene expression for susceptible fish at 14 dpe. Each dot represents the average value of one gene across three biological replicates. Red indicates the gene was significant at the FDR-adjusted p-value and Log2-Foldchange threshold, blue is significantly only by p-value, green only by Log2-Foldchange, and gray were not significant by either metric. B) Same as (A), but for susceptible fish at 21 dpe.
