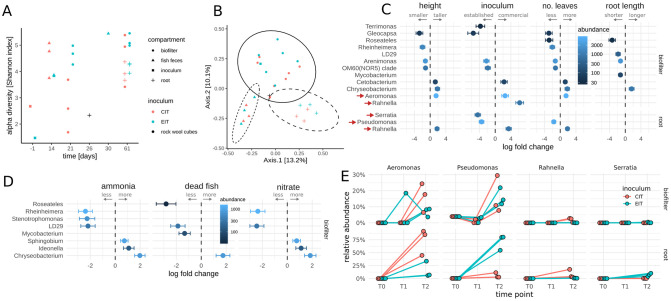
Fig 3. Amplicon sequencing of the full-length 16S rRNA gene across the aquaponic systems.
(A) Alpha-diversity (Shannon index) over time. Colors and shapes denote initial microbial sources and sampling compartments respectively. All samples were rarefied to 3,000 reads each. (B) (B) PCoA plot of individual samples from all time points. Colors and shapes are the same as in panel A. All samples were rarefied to 3,000 reads each. Ellipses denote 95% confidence interval from Student t-distribution separating compartments. (C) Significant associations (FDR adjusted p<0.05) between bacterial genera and plant growth metrics or inoculum. Points denote the association coefficient in the respective regression and error bars denote the standard error of the coefficient. Fill color denotes average abundance across all samples. (D) Significant associations (FDR adjusted p<0.05) between bacterial genera and measures associated with nitrification. Circles denote the association coefficient in the respective regression and error bars denote the standard error of the coefficient. Fill color denotes average abundance across all samples. (E) Time course of selected genera associated with plant growth and inoculum. Time point zero is shared between all samples and denotes initial inoculum for biofilter and initial plant microbial composition for roots. Only genera with more than 300 reads in at least 2 samples were considered in A-E (see Materials and methods).

