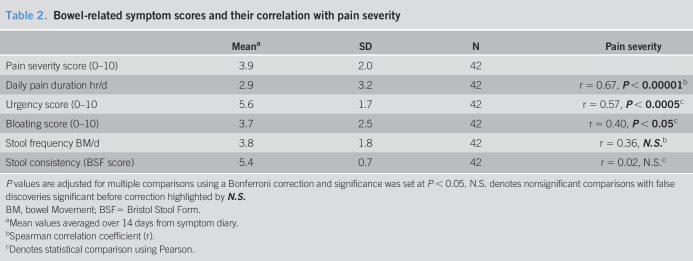
Table 2.
Bowel-related symptom scores and their correlation with pain severity
P values are adjusted for multiple comparisons using a Bonferroni correction and significance was set at P < 0.05. N.S. denotes nonsignificant comparisons with false discoveries significant before correction highlighted by N.S.
BM, bowel Movement; BSF= Bristol Stool Form.
Mean values averaged over 14 days from symptom diary.
Spearman correlation coefficient (r).
Denotes statistical comparison using Pearson.

