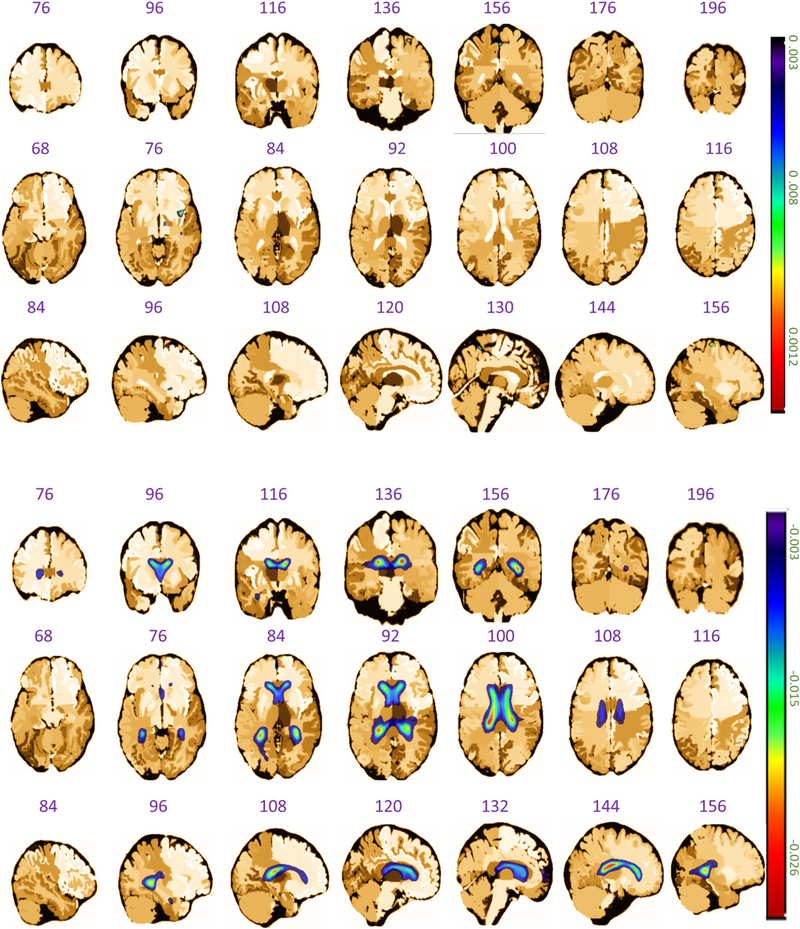
Figure 6.
The coronal, axial, and sagittal planes of the estimated first eigenimage in the analysis of ADNI dataset, where the upper three rows represent the positive values and the lower three rows denote the negative values. Note that the sign of an eigenimage is not identifiable in FPCA, and the +/− signs are used here only for separating the regions of eigenimages that exhibit opposite signs.

