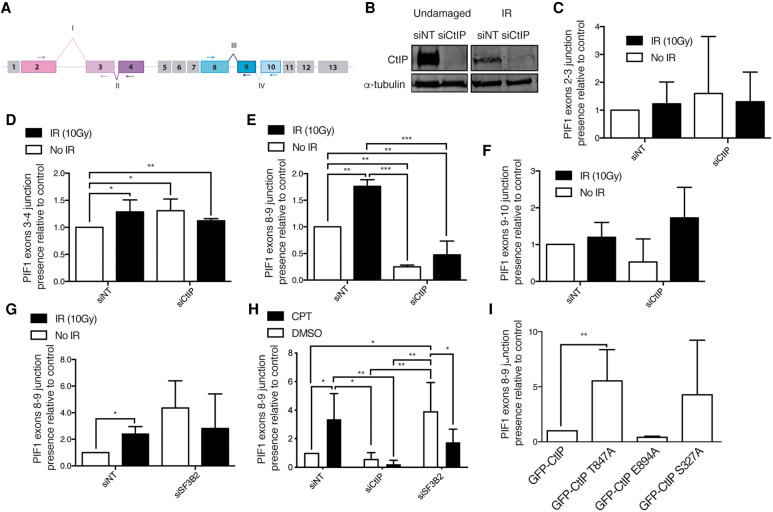
FIGURE 4.
PIF1 splicing changes upon CtIP depletion. (A) Schematic representation of PIF1 with the exons (boxes) and splicing events analyzed (roman numbers). (B) Representative western blots showing the expression levels of CtIP upon depletion with a siRNA against CtIP or a control sequence (siNT) in cells exposed or not to 10 Gy of ionizing radiation. α-tubulin blot was used as loading control. (C) Analysis of the exon 2 and exon 3 junctions using quantitative PCR using primers located in exons 2 and 3 (see panel A) in cells depleted (siCtIP) or not (siNT) for CtIP, upon exposure to IR (black bars) or in unchallenged conditions (white bars). The data were normalized to the expression of a constitutive exon. The abundance of such events was normalized to the control cells in undamaged conditions. The average and standard deviation of three independent experiments is shown. Statistical significance was calculated using an ANOVA test. (*) P < 0.05, (**) P < 0.01, and (***) P < 0.005. (D) Same as B but for the inclusion of exon 4. Primers in exons 2 and 4 were used (see panel A). Other details as in panel B. (E) Same as B but for the inclusion of exon 9. Primers in exons 8 and 9 were used (see panel A). Other details as in panel B. (F) Same as B but for the inclusion of exon 10. Primers in exons 8 and 10 were used (see panel A). Other details as in panel B. (G) Same as E but upon depletion of SF3B2 instead of CtIP. (H) Same as E but upon depletion of either CtIP or SF3B2 as indicated and in cells exposed for 6 h to camptothecin (CPT, black bars) or DMSO (white bars). (I) Study of the exon 8–9 junction in cells depleted for endogenous CtIP and expressing the indicated mutants of CtIP. Other details as in panel B.

