FIGURE 7.
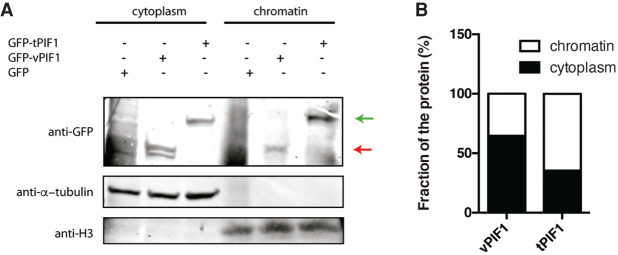
Cellular localization of PIF1 splicing variants. (A) Protein samples from undamaged cells expressing the indicated PIF1 isoforms were fractionated as described in the Materials and Methods section. Cytoplasmic and chromatin fractions were resolved in SDS-PAGE and blotted with the indicated antibodies. vPIF1 is marked with a red arrow. tPIF1 is located with a green arrow. A representative experiment is shown. (B) Western blots from A were quantified using an Odyssey Infrared Imaging System (LI-COR) and ImageStudio software (LI-COR). The ration between the cytoplasmic and chromatin fraction of each PIF1 isoform is represented.

