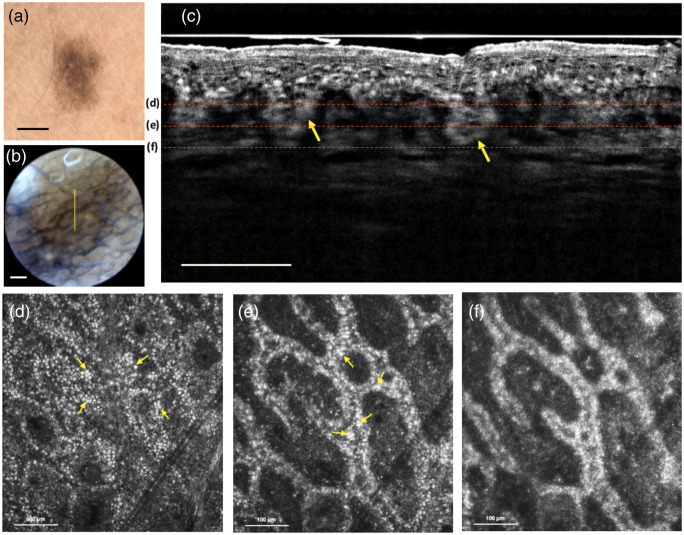
Fig. 3.
Junctional nevus: (a) dermoscopy image. Scale bar: 1 mm. (b) The guiding image. The yellow line represents the section region of the B-scan image. Scale bar: . (c) In vivo FF-OCT B-scan image. The yellow arrows show the nevus nest in the DEJ. Scale bar: . (d)–(f) In vivo FF-OCT en face images at imaging depths of 90, 110, and , respectively. The red dashed lines in (c) show the different depths of the en face images from (d)–(f). The images show the elongation of rete ridges and increase hyper-reflective melanocytes. The yellow arrows in (d) and (e) indicate the hyper-reflective melanocytes.

