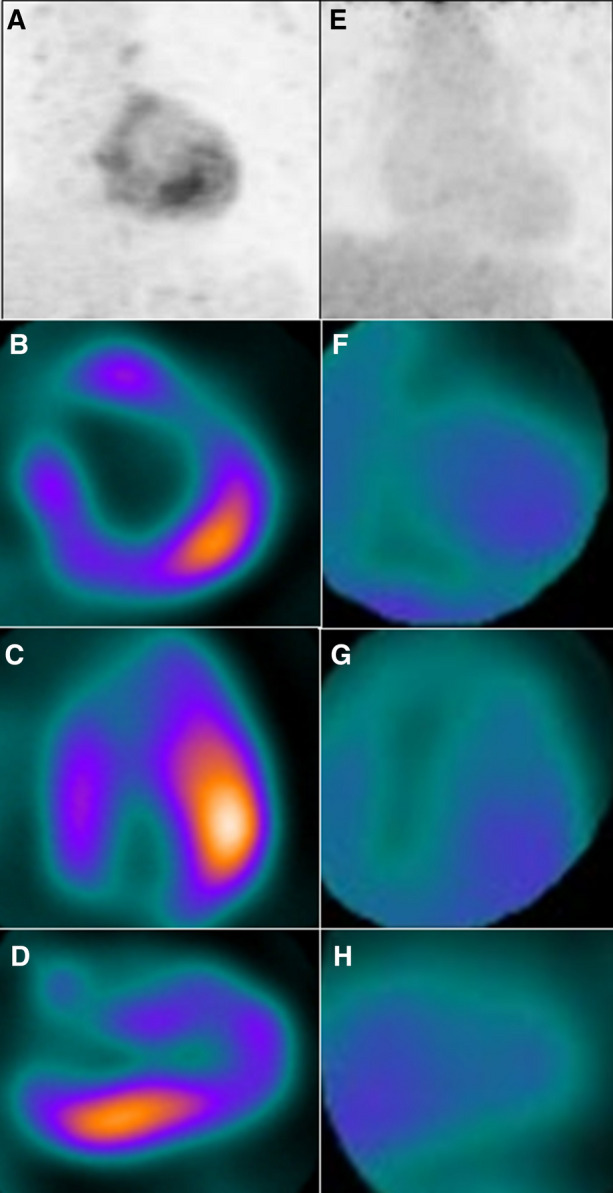
Figure 1.

Baseline maximum intensity projection (A), short axis (B), horizontal long axis (C) and vertical long axis (D) images showing increased 18F-FDG uptake in the inferolateral wall of the LV myocardium. Corresponding follow-up images (E to H) after six weeks showing resolution of hypermetabolism in the inferolateral wall with no other FDG avid focus
