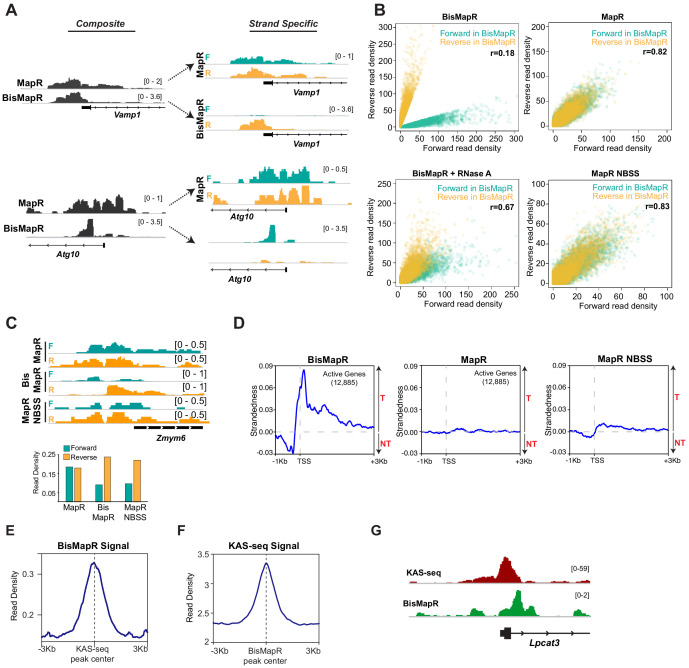
Figure 2. BisMapR confers strand specificity to nuclease-based genome-wide R-loop detection.
(A) Genome browser views of the Vamp1 and Atg10 genes showing composite (dark gray) BisMapR and MapR signals (reads per million, RPM) (left) and the same signal when separated into forward (teal) and reverse (orange) strands (right). (B) Correlation plots of normalized read densities between forward and reverse strands in BisMapR, MapR, BisMapR samples treated with RNase A, and MapR samples without bisulfite treatment and with second-strand synthesis (NBSS). TSS regions of 19,655 genes with high specificity toward forward (teal, 9788 genes) or reverse (orange, 9867 genes) strand signals in BisMapR, defined as log2 ratio of at least 1.5 in either direction between forward or reverse read densities, are shown. r, Pearson correlation coefficients between forward and reverse read densities for all 19,655 genes. (C) Top, genome browser view of the Zmym6 gene showing forward (teal) and reverse (orange) strand R-loop signal (reads per million, RPM) for MapR, BisMapR, and MapR NBSS. Bottom, bar chart of total forward and reverse strand read densities across the region. (D) Strandedness plots of BisMapR, MapR, and MapR NBSS strand-specific signals around the transcription start sites (TSS) of 13,380 active genes in mESCs. Strandedness was calculated as the difference between template (T) and non-template (NT) signal (reads per million, RPM). (E) Signal plot of composite BisMapR signal (reads per million, RPM) centered around 40,900 KAS-seq peaks. (F) Signal plot of KAS-seq signal centered around 168,774 composite BisMapR peaks. (G) Genome browser view of the Lpcat3 gene showing KAS-seq (red) and composite BisMapR (green) signal (reads per million, RPM).


