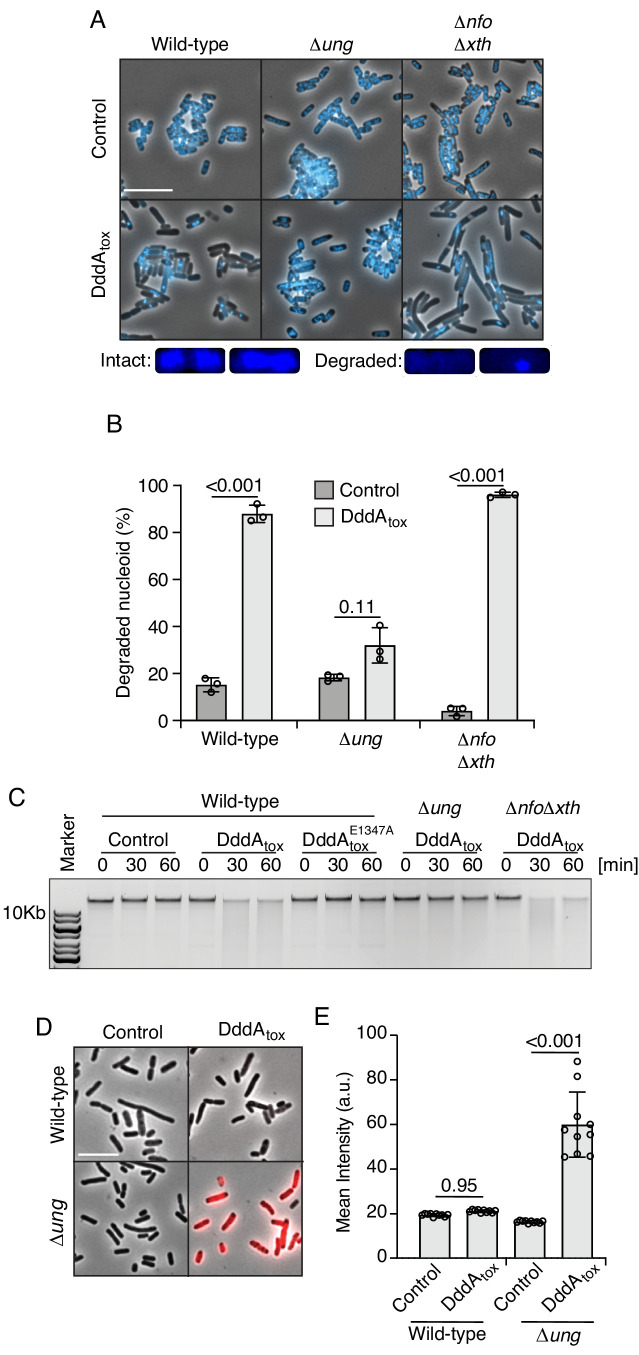
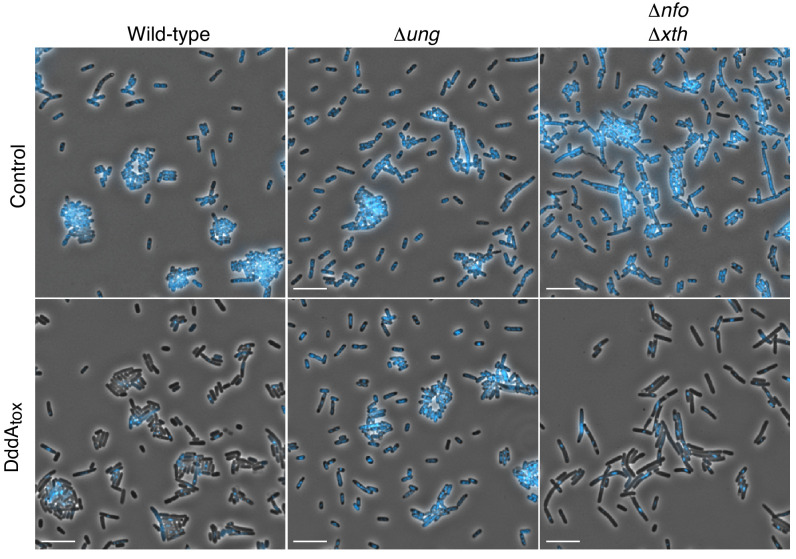
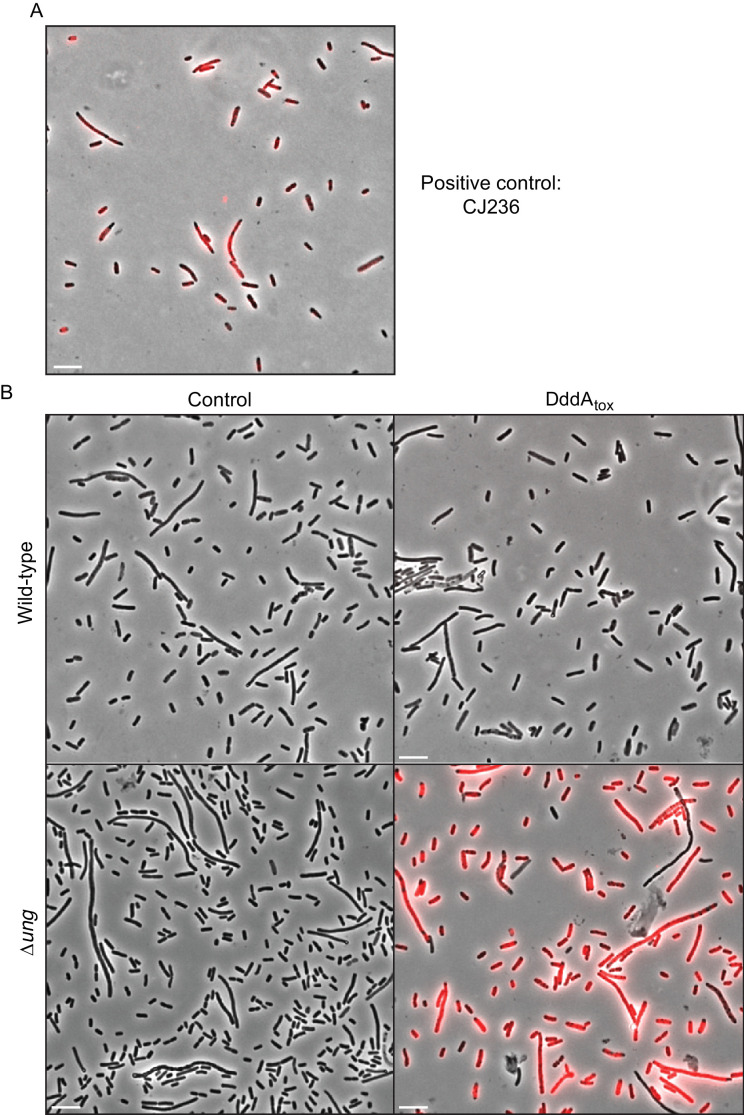
Figure 1. Double-stranded DNA deaminase A (DddA) expression leads to nucleoid degradation in E. coli wild-type cells and uracil accumulation in E. coli Δung.
(A) Fluorescence microscopy of the indicated E. coli strains expressing DddAtox or carrying an empty vector (Control). DAPI staining (DNA) is shown in cyan. Top: Representative micrographs for each condition, scale bar = 10 μm. Bottom: representative images of cells with intact or degraded nucleoids. (B) Quantification of nucleoid state in cells shown in A (n ≈100–200 cells per condition). (C) Agarose gel electrophoresis analysis of total genomic DNA isolated from the indicated E. coli strains expressing DddAtox, DddAtoxE1347A, or carrying an empty vector (Control) after induction for the time period shown. (D) Fluorescence microscopy indicating genomic uracil incorporation (red) of E. coli strains expressing DddAtox or carrying an empty vector (Control), scale bar = 10 μm. (E) Quantification of uracil labeling signal from cells shown in D (n ≈50 cells per condition). Values and error bars reflect mean ± s.d. of n = 2 independent biological replicates. p-Values derive from unpaired two-tailed t-test.


