
Figure 2.
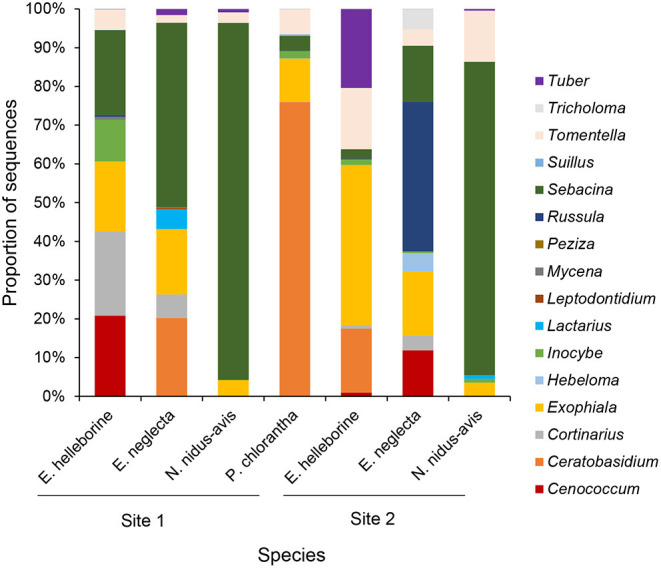
Bar charts representing the cumulative proportions of sequences belonging to different fungal genera observed in the sampled populations of each orchid species.
Official websites use .gov
A
.gov website belongs to an official
government organization in the United States.
Secure .gov websites use HTTPS
A lock (
) or https:// means you've safely
connected to the .gov website. Share sensitive
information only on official, secure websites.
Bar charts representing the cumulative proportions of sequences belonging to different fungal genera observed in the sampled populations of each orchid species.