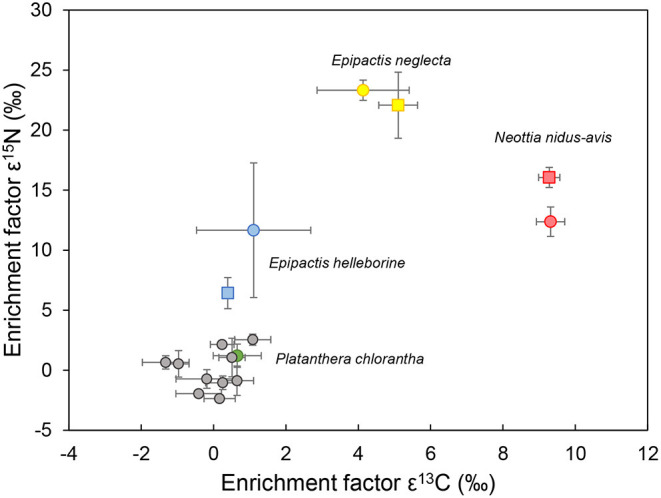
Figure 3.

Enrichment factors ε13C and ε15N of four orchid species (blue: Epipactis helleborine, yellow: E. neglecta, red: Neottia nidus-avis and green: Platanthera bifolia) sampled at two different locations (site 1: dots; site 2: squares). Gray dots represent enrichment factors of autotrophic plants sampled at both locations. Values represent the mean of five individuals per species population, while bars represent standard deviations.
