FIGURE 3.
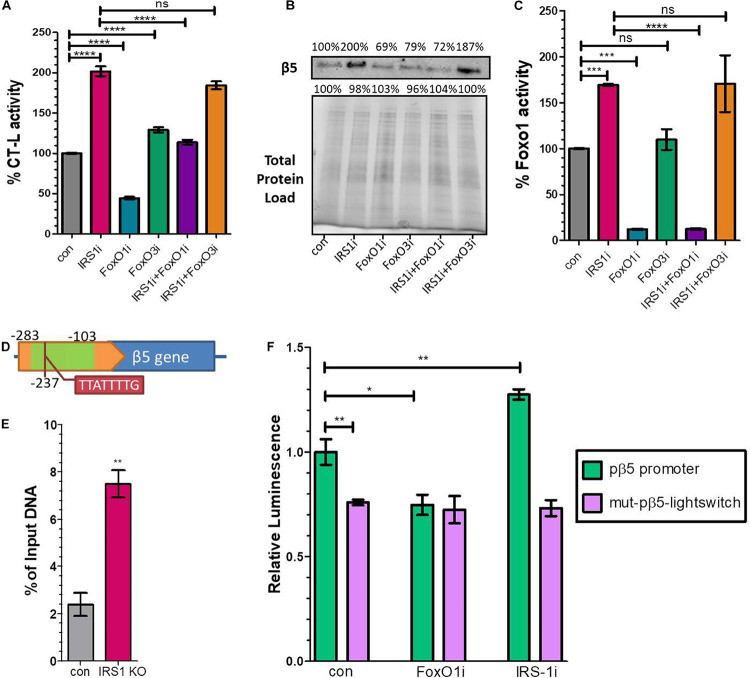
FoxO1 binds to the murine β5 promoter to regulate gene expression. (A) % CT-L activities, (B) Immunoblot analysis of the β5 subunit and (C) FoxO1 activity in the presence of siRNAs targeting IRS1, FoxO1, FoxO3 or control as indicated. 100% has been arbitrarily set to the average values of the control samples and the total protein load was used as a control for equal protein loading. (D) Schematic diagram of the promoter region of β5 subunit. The green area indicates the amplified chromatin immunoprecipitation products, while the tab indicates the speculatory FoxO binding site. (E) Chromatin immunoprecipitation analysis of the β5 promoter region from control or Irs1 depleted MEFs, using an anti-FoxO1 antibody. The amount of immunoprecipitated DNA was evaluated by RT-PCR. Histogram was constructed by the ratios of the immunoprecipitated DNA to the input (arbitrarily set to 100%). (F) Luciferase signal driven by the proximal wild type β5 promoter region (pβ5-lightswitch) or by a mutagenized version (mut-pβ5-lightswitch) with 8 bp substitutions on the detected FoxO binding motif in the presence of siRNAs targeting FoxO1, IRS1 or control as indicated. The signal of the empty vector has been deducted from raw values. The luminescence of wild type promoter under control conditions has been arbitrarily set to 1. *P < 0.05, **P < 0.01, ***P < 0.001, ****P < 0.0001.

