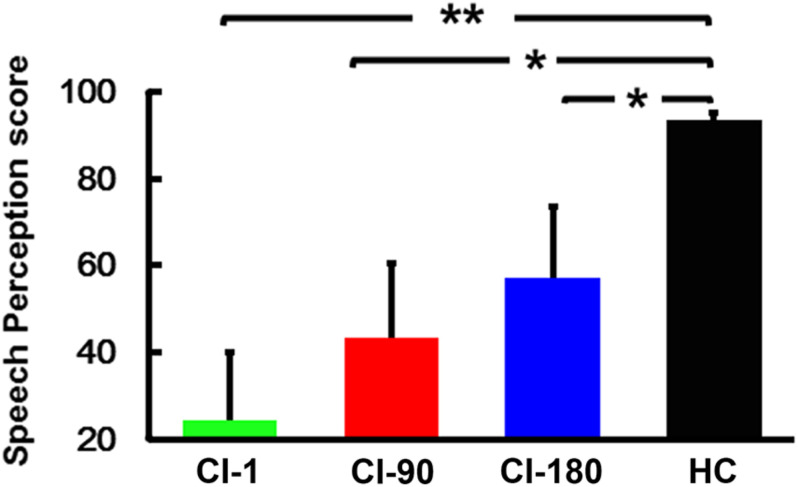
FIGURE 2.
Speech perception score within groups, where the green histogram represents when the device is activated, the red histogram represents 90 days after device activation, the blue histogram represents 180 days after device activation, and the black histogram represents healthy controls. The vertical black line means standard deviation; *P < 0.05 and **P < 0.001.

