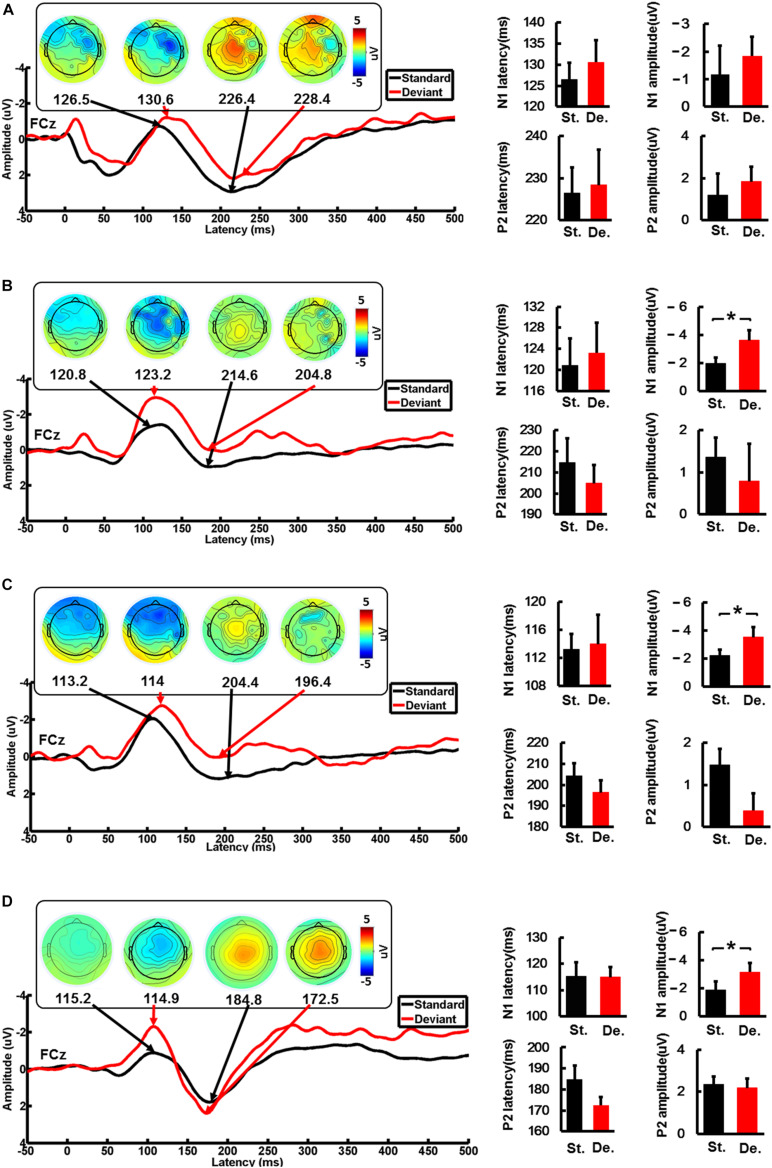
FIGURE 3.
The average waveforms of the standard stimulus and the deviation stimulus at the FCz electrode. The topographic map of the N1 and P2 feature points, and the comparison of the amplitude and the latency of the standard stimulus and the deviation stimulus for CI users and the HC group. (A) When the device is activated, (B) 90 days after device activation, (C) 90 days after device activation, and (D) healthy controls. St., standard stimulus; De., standard stimulus. The vertical black line means standard error; *P < 0.05.

