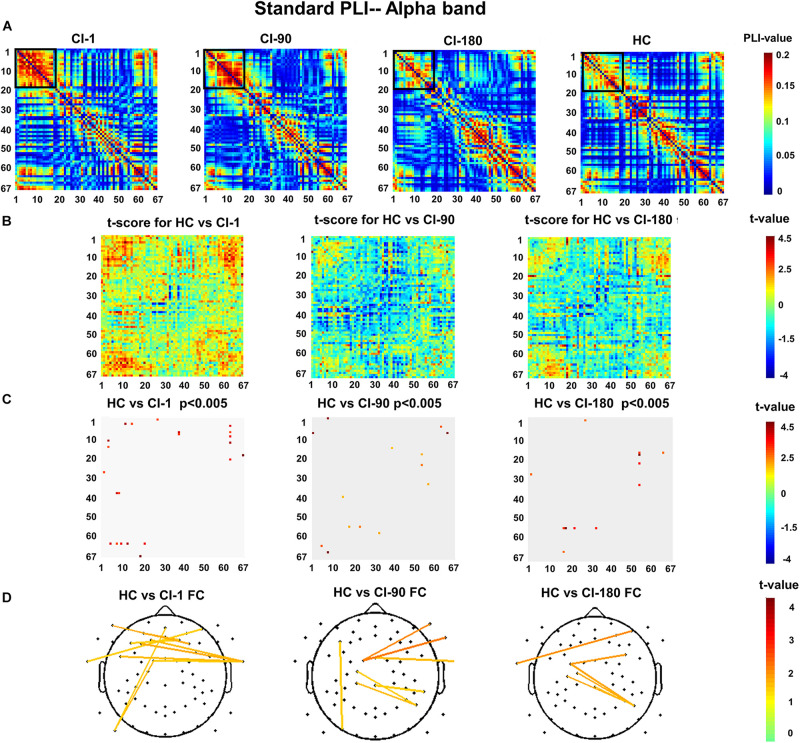
FIGURE 7.
The standard stimulus function connection analysis (A) presents the values of the standard stimulus phase lag index (PLI) for 67 electrode pairs in the CI group and the HC group. (B) The t scores for differences between the HC and the CI groups and (C) adjusted for the false discovery rate P < 0.005. (D) The t scores adjusted for P < 0.005 and differential functional connection across the topography. The black box indicates the electrode pair area with the main difference. FC, functional connection.

