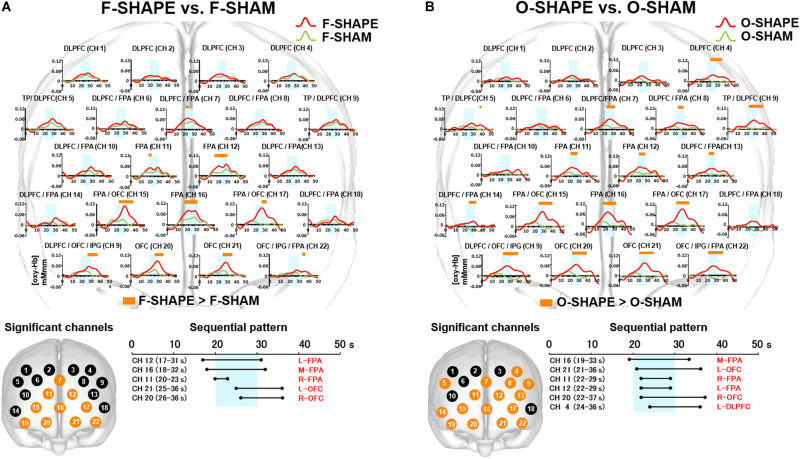
FIGURE 5.
Prefrontal functional near-infrared spectroscopy (fNIRS) activities in SHAPE as compared to SHAM. (A) Temporal differences and sequential pattern of prefrontal fNIRS activities in F-SHAPE as compared to F-SHAM. Prefrontal activations presented significant (two-way repeated measures ANOVA and Bonferroni t-test: p < 0.05) in the frontopolar area (FPA) and orbitofrontal cortex (OFC) during F-SHAPE as compared to F-SHAM. A sequential pattern of significantly shifting features in the onset and burst was noted from the FPA to the OFC during F-SHAPE as compared to F-SHAM. (B) Temporal differences and sequential pattern of the prefrontal fNIRS activities in O-SHAPE as compared to O-SHAM. Most channels presented significant (two-way repeated measures ANOVA and Bonferroni t-test: p < 0.05) prefrontal activation in O-SHAPE as compared to O-SHAM. A sequential pattern of significant (two-way repeated measures ANOVA and Bonferroni t-test: p < 0.05) prefrontal activation resulted in temporally overlapped features in the onset and burst of the DLPFC/FPA/OFC activities during O-SHAPE as compared to O-SHAM.

