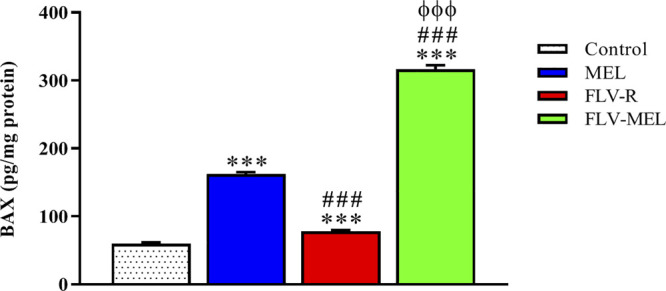
FIGURE 7.

Modulation of MEL, FLV-R, or MEL-FLV treatments on BAX protein concentrations in OVCAR3 cells. Data are the mean of 4 independent experiments ± SD. The post hoc Tukey test was used for multiple comparisons. ***Significantly different vs. control (p < 0.001). ###Significantly different vs. MEL (p < 0.001). ΦΦΦSignificantly different vs. FLV-R (p < 0.001).
