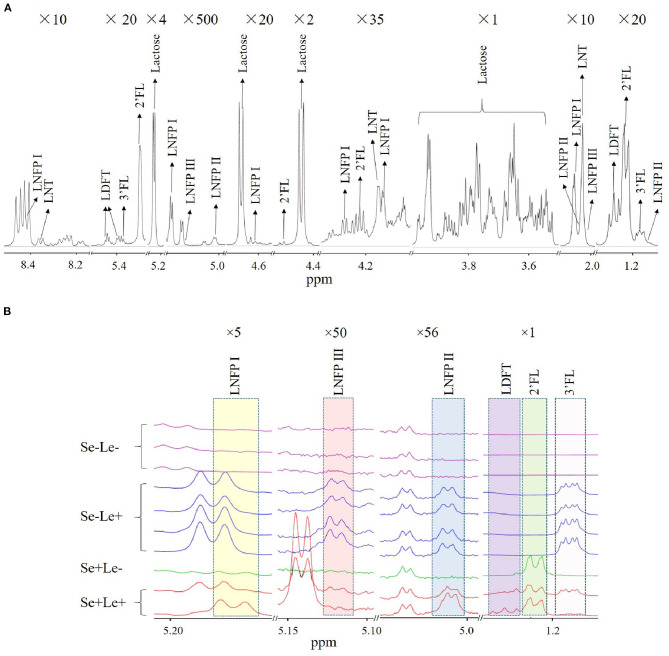
Figure 1.
Identification of HMOs in human milk NMR spectra. (A) Multiple peaks of each HMO are shown in 10 different chemical shift regions at various vertical scales to illustrate characteristic peaks associated with identified HMOs. Magnification is indicated at the top of each segment. (B) Comparison of NMR spectra of milk between individuals with putative differences in Se and Le status.

