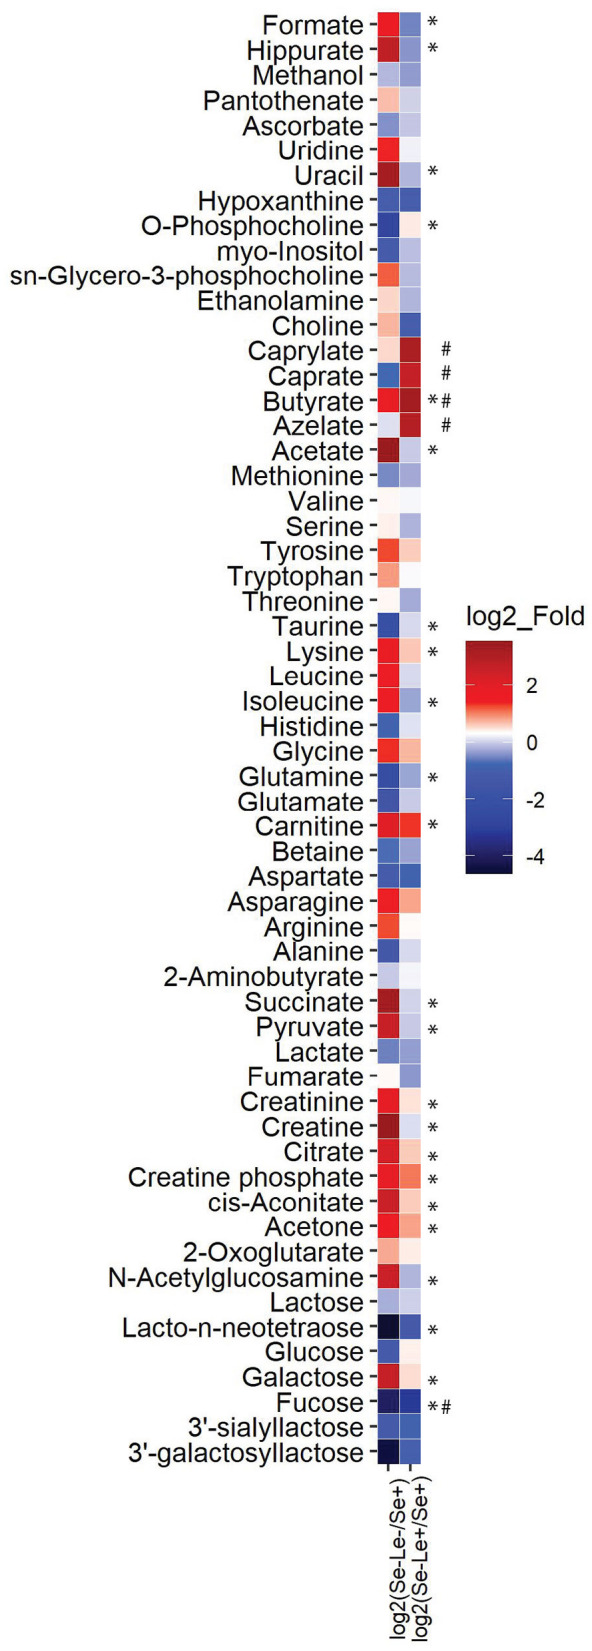
Figure 3.

Fold difference of metabolite concentrations in milk from Se–Le– and Se–Le+ mothers relative to Se+ mothers. The mean concentration of each metabolite was calculated for all groups and the means of the Se–Le– and Se–Le+ groups were divided by the mean of the metabolite concentration from the Se+ groups to determine the ratio relative to the Se+ groups. The ratio values were then log2 transformed. Log2_fold values over 1.5 or below −1.5 are indicated in the figure. * log2_fold over 1.5 or below −1.5 when comparing Se–Le– to Se+ samples. # log2_fold over 1.5 or below −1.5 when comparing Se–Le+ to Se+ samples.
