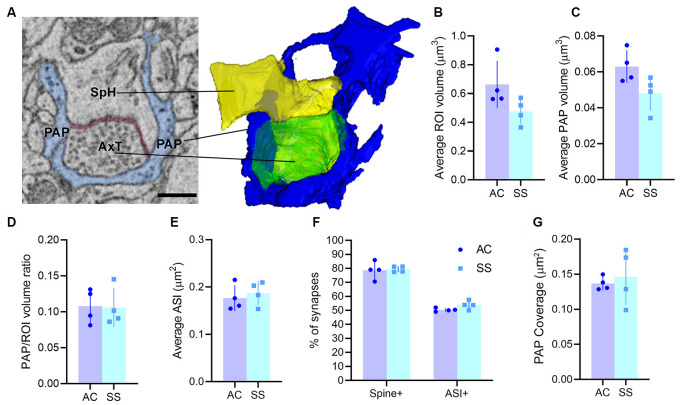
Figure 1.
(A) Example of region of interest (ROI) showing an axo-spinous synapse with perisynaptic astrocytic process (PAP; blue), axon terminal (AxT), spine head (SpH), axon-spine interface (ASI, red), and relative 3D reconstruction. Scale bar: 400 nm. (B,C) Average ROI and PAP volumes, respectively. (D) Ratio between PAP and ROI volumes. (E) Average ASI size. (F) Percentage of synapses contacting the spine (spine+) and the synaptic cleft (ASI+). (G) Synaptic coverage as measured by the size of the interfacing surface between the PAP and the spine head. In panels (B–G) AC and SS refer to anterior cingulate and somatosensory cortex (paired t-test, n = 4).

