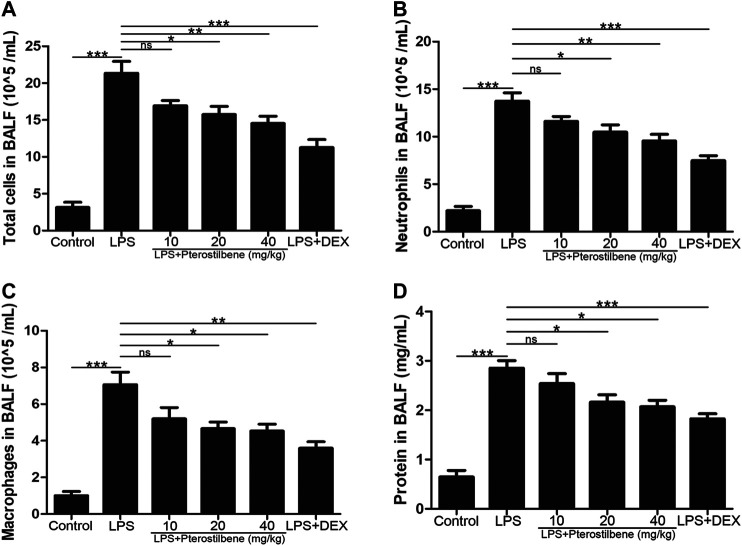
FIGURE 2.
PTER reduced LPS-induced the number of inflammatory cells and protein concentration in BALF. (A) Total cells in BALF. (B) Neutrophils in BALF. (C) Macrophages in BALF. (D) Protein concentration in BALF. Values are presented as mean ± SEM (n = 6). p values of <0.05 were considered significant (*p < 0.05; **p < 0.01; ***p < 0.001; “ns” means not significant).

