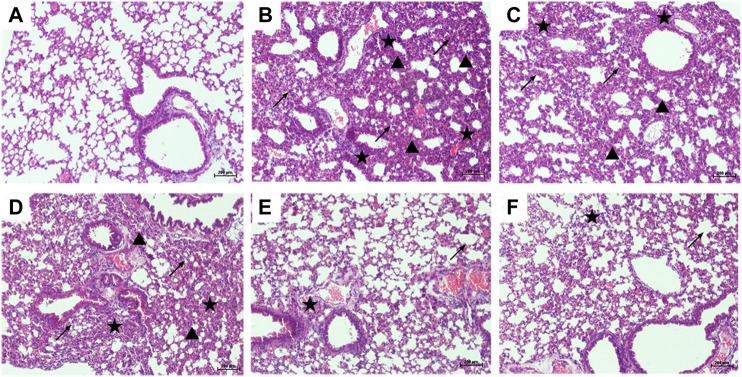
FIGURE 4.
PTER attenuated LPS-induced histopathological changes in the lungs (100×). Mice treated with (A) 0.9% NaCl solution (B) LPS + 0.9% NaCl solution (C) LPS + PTER 10 mg/kg (D) LPS + PTER 20 mg/kg (E) LPS + PTER 40 mg/kg (F) LPS + DEX 5 mg/kg. The stars show a large number of inflammatory cells infiltrating, the triangles show thickening of alveolar septum, and the arrows show destruction of alveolar structure.

