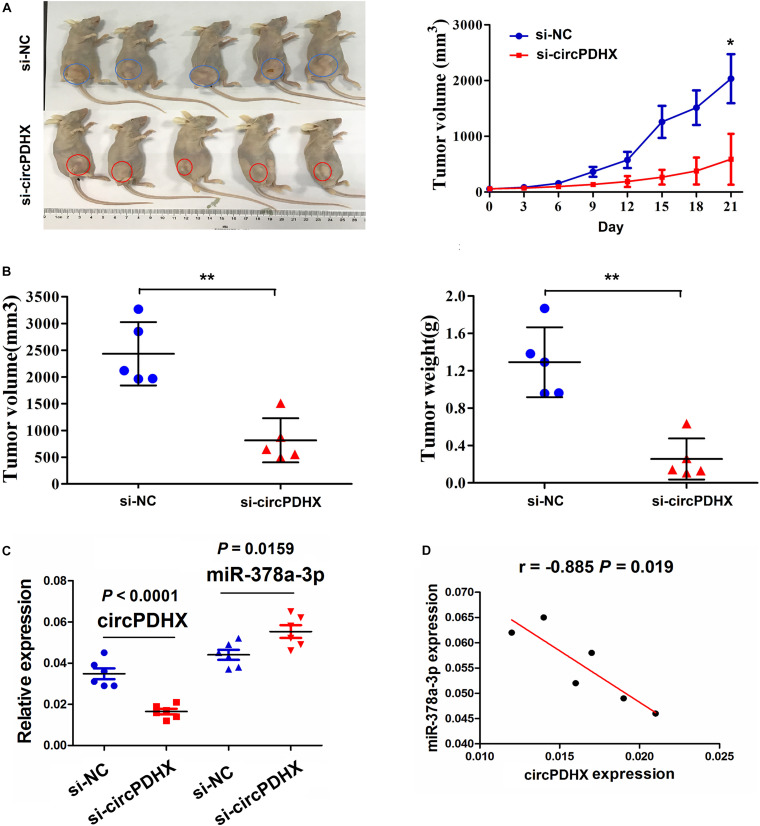
FIGURE 7.
Knockdown of circPDHX suppressed PC3 xenograft tumor growth. (A) Representative photographs of the xenograft tumors and assessment of the tumor proliferation trend after treatment with si-circPDHX or si-NC transfected PC3 cells. (B) Comparison of PC3 xenograft tumor volume and weight between si-circPDHX and si-NC groups. (C) Quantitative real-time PCR (qRT-PCR) analysis of circPDHX and miR-378a-3p expression in si-circPDHX or si-NC treated PC3 tumor tissues. (D) Pearson correlation analysis of the correlation of circPDHX with miR-378a-3p expression in si-circPDHX-treated PC3 tumor tissues. Data shown are the mean ± SEM of three experiments. *P < 0.05; **P < 0.01.

